onsider an economy with 2 plants, A and B, whose operations produce emissions. The graphs show the marginal benefits (MB) to each plant from its emissions on the y-axis (in Euros) and the quantity of emissions in tons on the x-axis. The graph on the left represents the case when the government imposes a limit on emissions. The graph on the right represents the case when the government imposes a tax on emissions. a) let’s say the government limits the emissions of each plant at 4 tons. The marginal benefit of 4 tons of emissions to plant A is 2 euros. Referring to the graph on left, what is the welfare loss to plant A from the limit imposed by the government? (euros) b) now let’s say the government sets a unit tax on emissions of 6 euros. Under this tax, plant B will produce 6 tons of emissions and plant A will produce 2 tons of emissions. Referring to the graph on the right, what is the total net welfare from the imposition of the tax? (euros) c) which policy results in lower welfare losses for the economy as a whole, a unit tax of 6 euros or a regulatory limit of 4 tons of emissions for both plants? 1) regulatory limit 2) tax


Please explain each solution step by step.
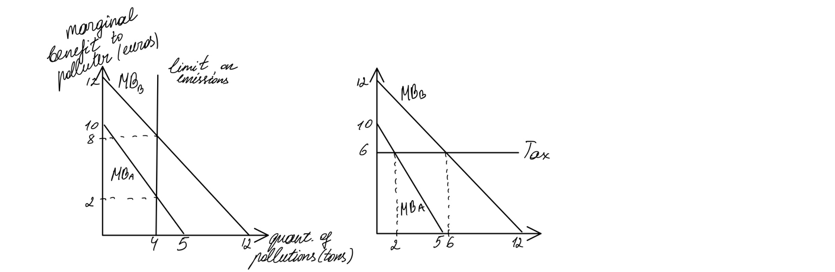
Consider an economy with 2 plants, A and B, whose operations produce emissions. The graphs show the marginal benefits (MB) to each plant from its emissions on the y-axis (in Euros) and the quantity of emissions in tons on the x-axis. The graph on the left represents the case when the government imposes a limit on emissions. The graph on the right represents the case when the government imposes a tax on emissions.
a) let’s say the government limits the emissions of each plant at 4 tons. The marginal benefit of 4 tons of emissions to plant A is 2 euros. Referring to the graph on left, what is the welfare loss to plant A from the limit imposed by the government? (euros)
b) now let’s say the government sets a unit tax on emissions of 6 euros. Under this tax, plant B will produce 6 tons of emissions and plant A will produce 2 tons of emissions. Referring to the graph on the right, what is the total net welfare from the imposition of the tax? (euros)
c) which policy results in lower welfare losses for the economy as a whole, a unit tax of 6 euros or a regulatory limit of 4 tons of emissions for both plants? 1) regulatory limit 2) tax

Step by step
Solved in 3 steps


