Operations Management CH 3 QUESTION 22 Tucson Machinery, Incorporated, manufactures numerically controlled machines, which sell for an average price of $0.5 million each. Sales for these NCMs for the past two years were as follows: Use Exhibit 3.10. QUARTER LAST YEAR QUANTITY (UNITS) QUARTER THIS YEAR QUANTITY (UNITS) I 12 I 16 II 18 II 24 III 26 III 28 IV 16 IV 18 a) Find a line using regression in Excel. Note: Round your answers to 3 decimal places. y = ________ + ________ t b)Find the trend and seasonal indexes. Note: Round your answers to 3 decimal places. Period Trend Forecast Seasonal Factors Last Year I Last Year II Last Year III Last Year IV This Year I This Year II This Year III This Year IV This is left blank This is left blank This is left blank c) Forecast sales for next year. Note: Round your answers to 2 decimal places. Period Forecast (Units) Next Year I Next Year II Next Year III Next Year IV Exhibit 3.10. (Yellow Graph)
Operations Management CH 3 QUESTION 22 Tucson Machinery, Incorporated, manufactures numerically controlled machines, which sell for an average price of $0.5 million each. Sales for these NCMs for the past two years were as follows: Use Exhibit 3.10. QUARTER LAST YEAR QUANTITY (UNITS) QUARTER THIS YEAR QUANTITY (UNITS) I 12 I 16 II 18 II 24 III 26 III 28 IV 16 IV 18 a) Find a line using regression in Excel. Note: Round your answers to 3 decimal places. y = ________ + ________ t b)Find the trend and seasonal indexes. Note: Round your answers to 3 decimal places. Period Trend Forecast Seasonal Factors Last Year I Last Year II Last Year III Last Year IV This Year I This Year II This Year III This Year IV This is left blank This is left blank This is left blank c) Forecast sales for next year. Note: Round your answers to 2 decimal places. Period Forecast (Units) Next Year I Next Year II Next Year III Next Year IV Exhibit 3.10. (Yellow Graph)

Practical Management Science
6th Edition
ISBN:9781337406659
Author:WINSTON, Wayne L.
Publisher:WINSTON, Wayne L.
Chapter13: Regression And Forecasting Models
Section13.7: Exponential Smoothing Models
Problem 28P: The file P13_28.xlsx contains monthly retail sales of U.S. liquor stores. a. Is seasonality present...

Related questions
Question
Operations Management CH 3
QUESTION 22
Tucson Machinery, Incorporated, manufactures numerically controlled machines, which sell for an average price of $0.5 million each. Sales for these NCMs for the past two years were as follows: Use Exhibit 3.10.
| QUARTER LAST YEAR | QUANTITY (UNITS) | QUARTER THIS YEAR | QUANTITY (UNITS) |
|---|---|---|---|
| I | 12 | I | 16 |
| II | 18 | II | 24 |
| III | 26 | III | 28 |
| IV | 16 | IV | 18 |
a) Find a line using regression in Excel. Note: Round your answers to 3 decimal places.
| y = | ________ | + | ________ | t |
b)Find the trend and seasonal indexes. Note: Round your answers to 3 decimal places.
| Period | Trend |
Seasonal Factors | |
| Last Year | I | ||
| Last Year | II | ||
| Last Year | III | ||
| Last Year | IV | ||
| This Year | I | ||
| This Year | II | ||
| This Year | III | ||
| This Year | IV | ||
| This | is | left | blank |
| This | is | left | blank |
| This | is | left | blank |
c) Forecast sales for next year. Note: Round your answers to 2 decimal places.
| Period | Forecast (Units) | |
| Next Year | I | |
| Next Year | II | |
| Next Year | III | |
| Next Year | IV |
Exhibit 3.10. (Yellow Graph)
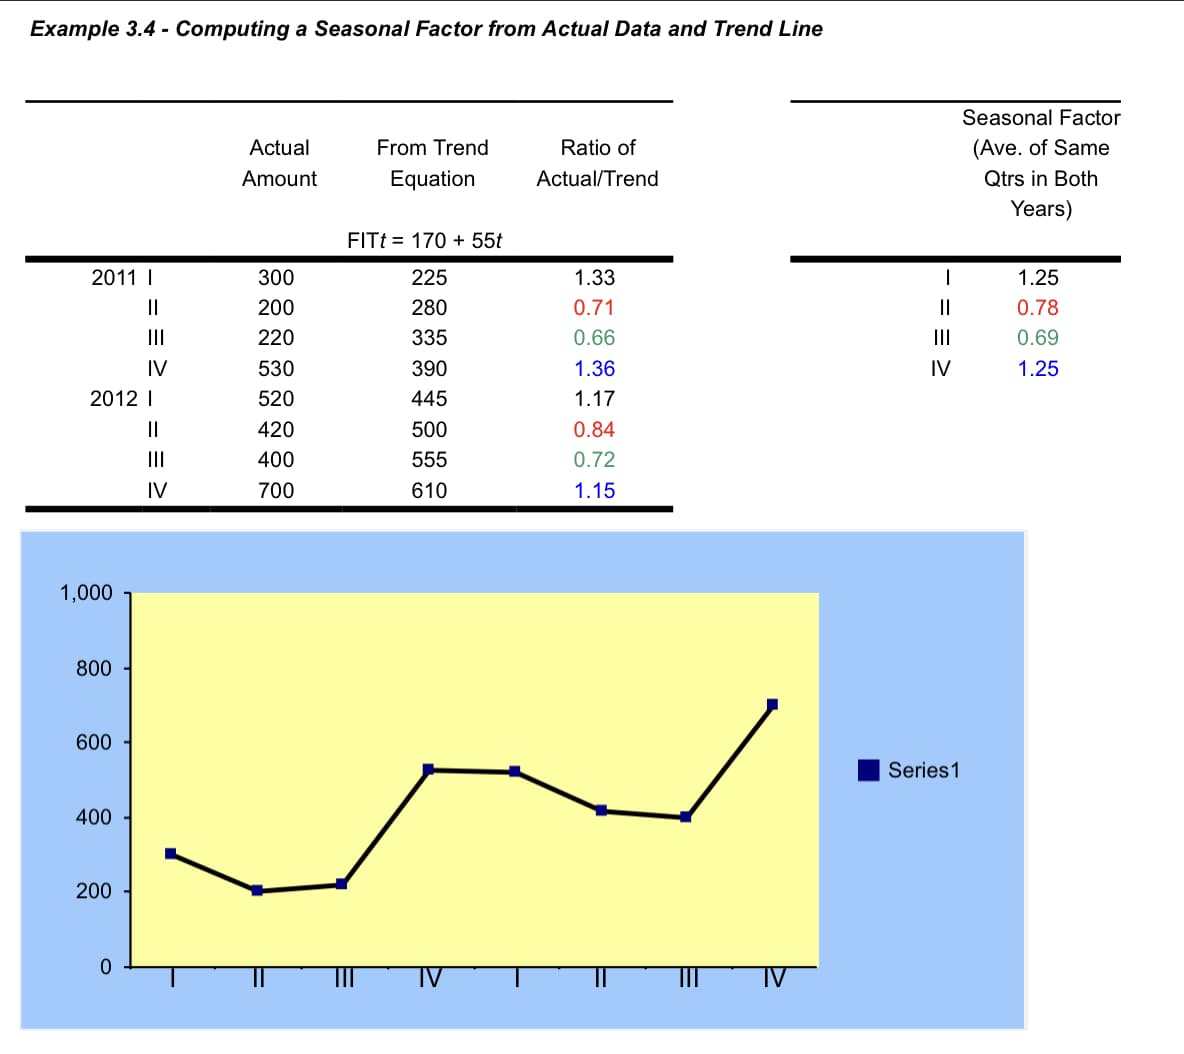
Transcribed Image Text:Example 3.4 - Computing a Seasonal Factor from Actual Data and Trend Line
2011 I
||
|||
IV
2012 I
||
|||
IV
1,000
800
600
400
200
0
Actual
Amount
300
200
220
530
520
420
400
700
From Trend
Equation
FITt = 170 + 55t
225
280
335
390
445
500
555
610
Ratio of
Actual/Trend
1.33
0.71
0.66
1.36
1.17
0.84
0.72
1.15
1
=
|||
IV
Series 1
Seasonal Factor
(Ave. of Same
Qtrs in Both
Years)
1.25
0.78
0.69
1.25
Expert Solution
This question has been solved!
Explore an expertly crafted, step-by-step solution for a thorough understanding of key concepts.

This is a popular solution!

Trending now
This is a popular solution!

Step by step
Solved in 2 steps with 5 images

Recommended textbooks for you
Practical Management Science
Operations Management
ISBN:
9781337406659
Author:
WINSTON, Wayne L.
Publisher:
Cengage,
Practical Management Science
Operations Management
ISBN:
9781337406659
Author:
WINSTON, Wayne L.
Publisher:
Cengage,