options to show all statistics available. Print this. 4. Clean the data a. Check for missing data values. Is the isna() with sum() method to identify missing cells. The result should look like this year o state o month o number 0 date o dtype: int64 b. The goal is to generate a bar chart with a count of the number of fires per month. Since there are months with 0 fires, you can eliminate these values from the data set. First, use the replace function to replace Os with NaN values (Not a Number). Use the np.nan value as the replacement value. Do a print of the head() of the data to now see NaN values. c. To remove the lines, use the dropna() function. This function looks for NaN values in a specific column. Research how to specify a column as the input parameter. Use the "number" column. 5. Group the data a. The goal in this step is to create a pandas series to be used in the chart. The data must be transformed so that there are totals by month. Research the pandas groupby() function syntax. The goal is to specify the number column as a list key and then sum() function to get the totals. Assign the results of the groupby0 function to a new variable which is the data series. b. Use the print() command for the variable in (a). This should show you totals for each month- in alphabetical order.
options to show all statistics available. Print this. 4. Clean the data a. Check for missing data values. Is the isna() with sum() method to identify missing cells. The result should look like this year o state o month o number 0 date o dtype: int64 b. The goal is to generate a bar chart with a count of the number of fires per month. Since there are months with 0 fires, you can eliminate these values from the data set. First, use the replace function to replace Os with NaN values (Not a Number). Use the np.nan value as the replacement value. Do a print of the head() of the data to now see NaN values. c. To remove the lines, use the dropna() function. This function looks for NaN values in a specific column. Research how to specify a column as the input parameter. Use the "number" column. 5. Group the data a. The goal in this step is to create a pandas series to be used in the chart. The data must be transformed so that there are totals by month. Research the pandas groupby() function syntax. The goal is to specify the number column as a list key and then sum() function to get the totals. Assign the results of the groupby0 function to a new variable which is the data series. b. Use the print() command for the variable in (a). This should show you totals for each month- in alphabetical order.

Chapter5: Working With Excel Tables, Pivottables, And Pivotcharts
Section: Chapter Questions
Problem 15RA

Related questions

Question
4 & 5 python
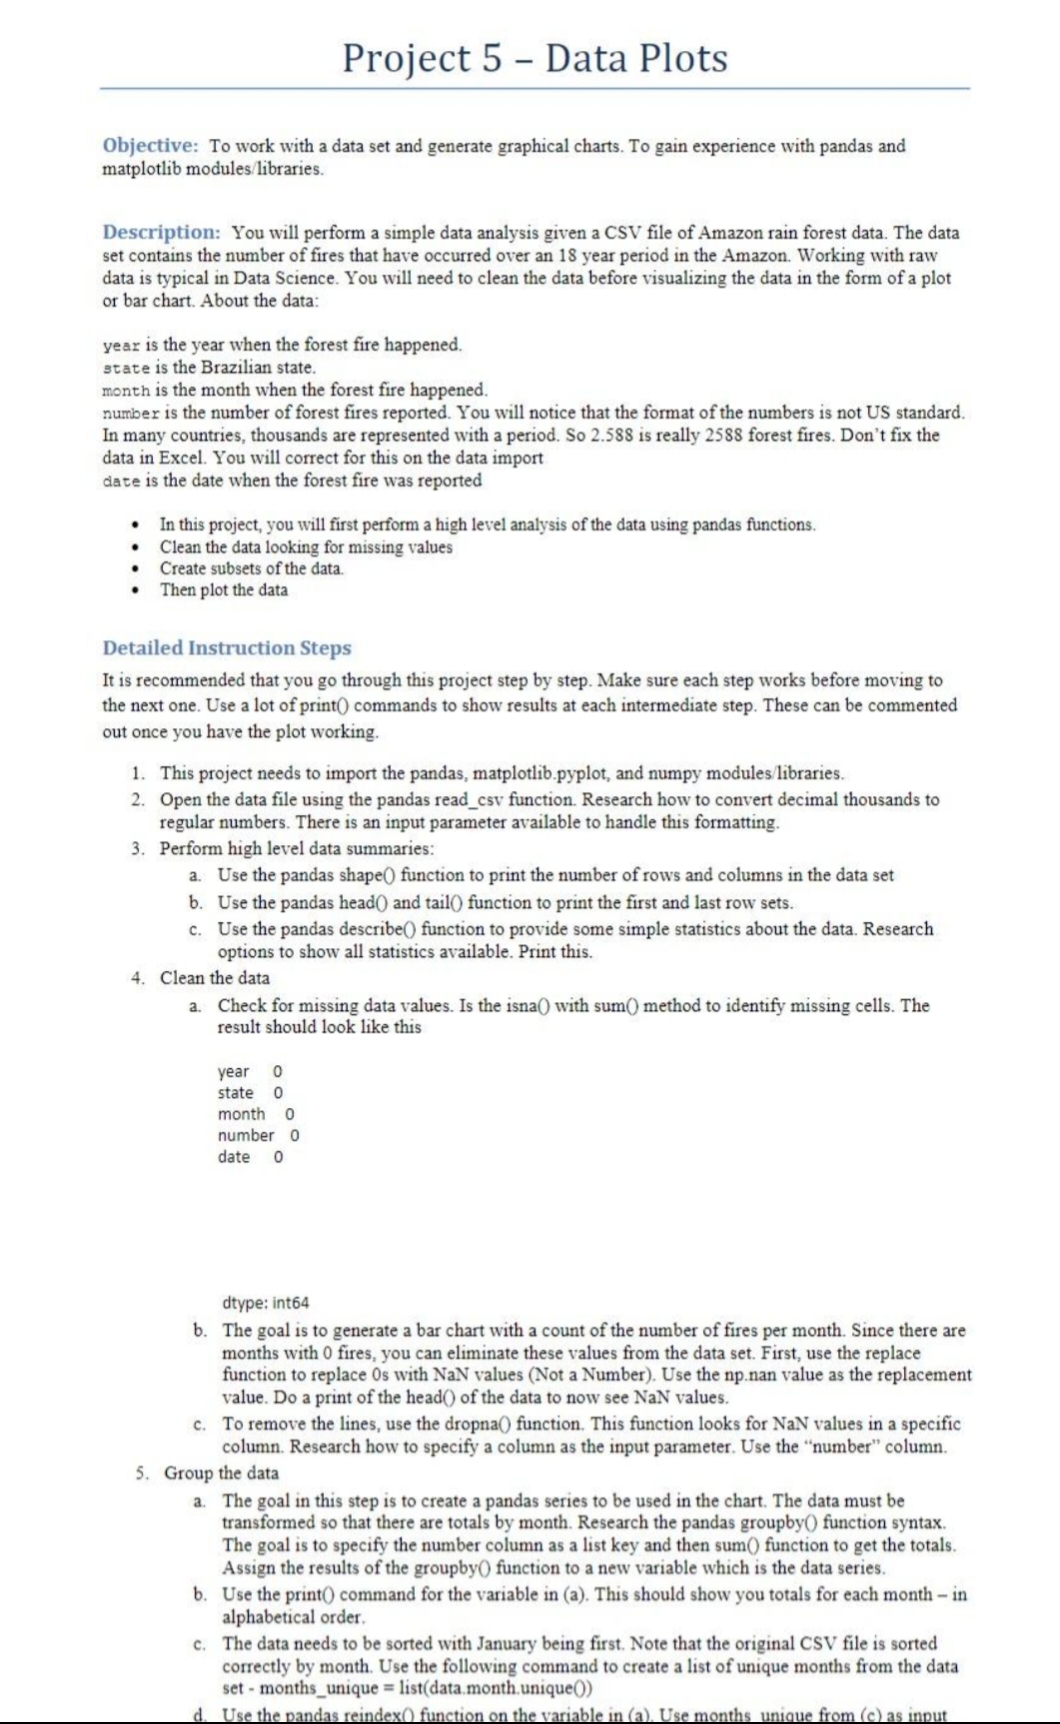
Transcribed Image Text:Project 5 – Data Plots
Objective: To work with a data set and generate graphical charts. To gain experience with pandas and
matplotlib modules/libraries.
Description: You will perform a simple data analysis given a CSV file of Amazon rain forest data. The data
set contains the number of fires that have occurred over an 18 year period in the Amazon. Working with raw
data is typical in Data Science. You will need to clean the data before visualizing the data in the form of a plot
or bar chart. About the data:
year is the year when the forest fire happened.
state is the Brazilian state.
month is the month when the forest fire happened.
number is the number of forest fires reported. You will notice that the format of the numbers is not US standard.
In many countries, thousands are represented with a period. So 2.588 is really 2588 forest fires. Don't fix the
data in Excel. You will correct for this on the data import
date is the date when the forest fire was reported
• In this project, you will first perform a high level analysis of the data using pandas functions.
Clean the data looking for missing values
Create subsets of the data.
Then plot the data
Detailed Instruction Steps
It is recommended that you go through this project step by step. Make sure each step works before moving to
the next one. Use a lot of print() commands to show results at each intermediate step. These can be commented
out once you have the plot working.
1. This project needs to import the pandas, matplotlib.pyplot, and numpy modules/libraries.
2. Open the data file using the pandas read_csv function. Research how to convert decimal thousands to
regular numbers. There is an input parameter available to handle this formatting.
3. Perform high level data summaries:
a. Use the pandas shape() function to print the number of rows and colu
ans in
data set
b. Use the pandas head() and tail() function to print the first and last row sets.
c. Use the pandas describe() function to provide some simple statistics about the data. Research
options to show all statistics available. Print this.
4. Clean the data
a. Check for missing data values. Is the isna() with sum() method to identify missing cells. The
result should look like this
year o
state o
month o
number 0
date
dtype: int64
b. The goal is to generate a bar chart with a count of the number of fires per month. Since there are
months with 0 fires, you can eliminate these values from the data set. First, use the replace
function to replace Os with NaN values (Not a Number). Use the np.nan value as the replacement
value. Do a print of the head() of the data to now see NaN values.
c. To remove the lines, use the dropna() function. This function looks for NaN values in a specific
column. Research how to specify a column as the input parameter. Use the "number" column.
5. Group the data
a. The goal in this step is to create a pandas series to be used in the chart. The data must be
transformed so that there are totals by month. Research the pandas groupby() function syntax.
The goal is to specify the number column as a list key and then sum() function to get the totals.
Assign the results of the groupby() function to a new variable which is the data series.
b. Use the print) command for the variable in (a). This should show you totals for each month- in
alphabetical order.
c. The data needs to be sorted with January being first. Note that the original CSV file is sorted
correctly by month. Use the following command to create a list of unique months from the data
set - months_unique = list(data.month.unique())
d. Use the pandas reindex) function on the variable in (a). Use months unique from (c) as input
Expert Solution
This question has been solved!
Explore an expertly crafted, step-by-step solution for a thorough understanding of key concepts.

Step by step
Solved in 4 steps with 4 images

Knowledge Booster


Learn more about
Need a deep-dive on the concept behind this application? Look no further. Learn more about this topic, computer-science and related others by exploring similar questions and additional content below.
Recommended textbooks for you
Np Ms Office 365/Excel 2016 I Ntermed
Computer Science
ISBN:
9781337508841
Author:
Carey
Publisher:
Cengage
COMPREHENSIVE MICROSOFT OFFICE 365 EXCE
Computer Science
ISBN:
9780357392676
Author:
FREUND, Steven
Publisher:
CENGAGE L

New Perspectives on HTML5, CSS3, and JavaScript
Computer Science
ISBN:
9781305503922
Author:
Patrick M. Carey
Publisher:
Cengage Learning
Np Ms Office 365/Excel 2016 I Ntermed
Computer Science
ISBN:
9781337508841
Author:
Carey
Publisher:
Cengage
COMPREHENSIVE MICROSOFT OFFICE 365 EXCE
Computer Science
ISBN:
9780357392676
Author:
FREUND, Steven
Publisher:
CENGAGE L
New Perspectives on HTML5, CSS3, and JavaScript
Computer Science
ISBN:
9781305503922
Author:
Patrick M. Carey
Publisher:
Cengage Learning