OT data max = What is the minimum of this data set? min = What is the range of this data set?
OT data max = What is the minimum of this data set? min = What is the range of this data set?

Glencoe Algebra 1, Student Edition, 9780079039897, 0079039898, 2018
18th Edition
ISBN:9780079039897
Author:Carter
Publisher:Carter
Chapter10: Statistics
Section10.6: Summarizing Categorical Data
Problem 4BGP

Related questions
Question
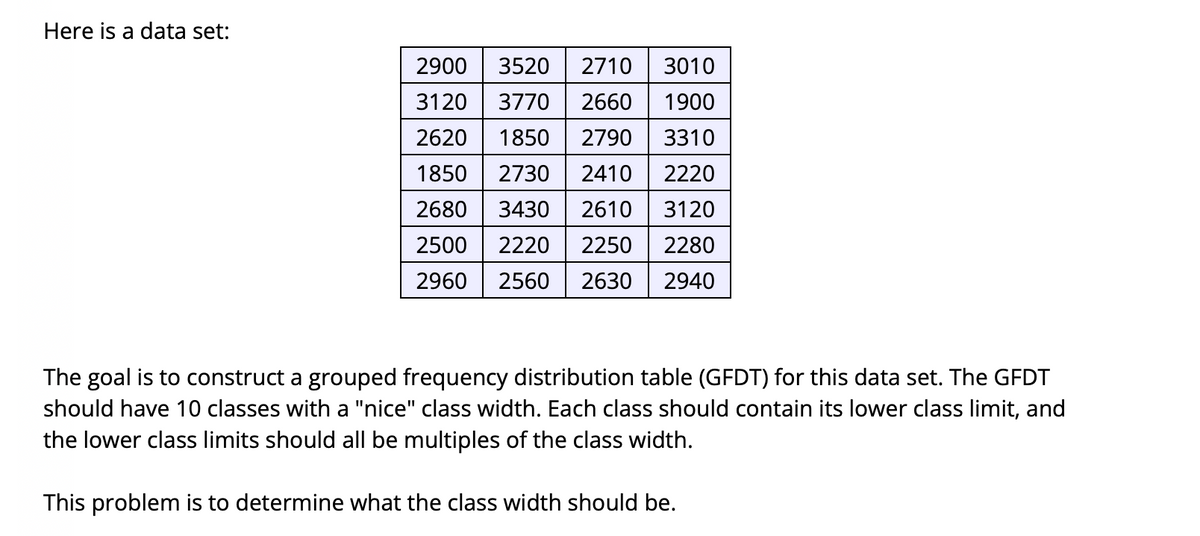
Transcribed Image Text:Here is a data set:
2900
3520
2710
3010
3120
3770
2660
1900
2620
1850
2790
3310
1850
2730
2410
2220
2680
3430
2610
3120
2500
2220
2250
2280
2960
2560
2630
2940
The goal is to construct a grouped frequency distribution table (GFDT) for this data set. The GFDT
should have 10 classes with a "nice" class width. Each class should contain its lower class limit, and
the lower class limits should all be multiples of the class width.
This problem is to determine what the class width should be.
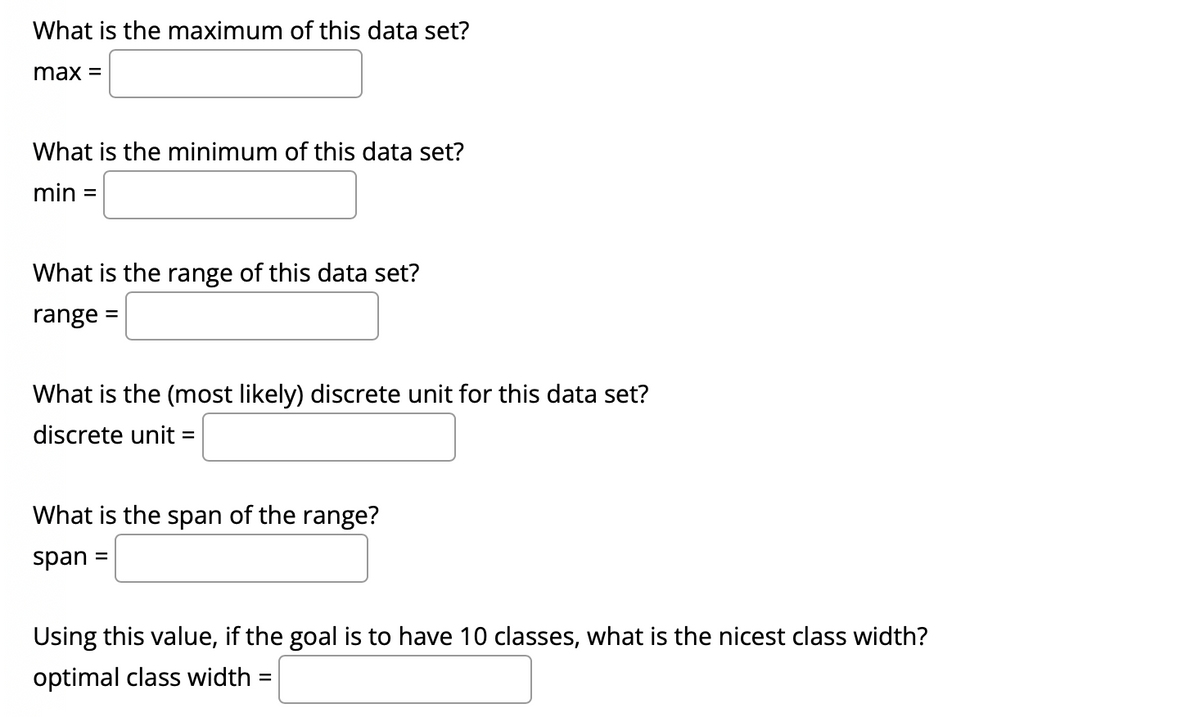
Transcribed Image Text:What is the maximum of this data set?
max =
What is the minimum of this data set?
min
%D
What is the range of this data set?
range
What is the (most likely) discrete unit for this data set?
discrete unit =
What is the span of the range?
span
%3D
Using this value, if the goal is to have 10 classes, what is the nicest class width?
optimal class width =
Expert Solution
This question has been solved!
Explore an expertly crafted, step-by-step solution for a thorough understanding of key concepts.

Step by step
Solved in 2 steps

Recommended textbooks for you
Glencoe Algebra 1, Student Edition, 9780079039897…
Algebra
ISBN:
9780079039897
Author:
Carter
Publisher:
McGraw Hill
Glencoe Algebra 1, Student Edition, 9780079039897…
Algebra
ISBN:
9780079039897
Author:
Carter
Publisher:
McGraw Hill