ou will see a student survey with 6 questions. This is a fictitious survey that I see y each of the 46,000 fictitious students at StatCrunch U. elow the survey you can set the sample size. Set this to 100 and click Genera oreadsheet will appear with the survey results for your random sample of 10 catCrunchU students. ote: Your sample is a random sample; therefore, your results will differ some ther students' results. ustructions for the lab assignment: How many females are in your sample? How many males? What proportio sample is female? What proportion of your sample is male? (StatCrunch st Tables, Frequency) Is there an equal proportion of men and women at StatCrunchU? а) Show that the conditions are met for the use of a normal model for test (np 2 10 and n(1- p) 2 10, where p is from the null hypothesis). b) Use StatCrunch to test the claim that the proportion of females at S equal to the proportion of men. Paste the StatCrunch printout below. (§ steps: Stat, Proportion Stats, One Sample, With Data. To copy click on C c) Write a conclusion to your hypothesis test referring to females at StatCr d) Explain what the P-value means as a probability that refers to random s 100 StatCrunchU students. What are the proportions of females and males at StatCrunchU? a) Show that the conditions are met for the use of a normal model for a co interval (count of successes and failures are greater than 10).
ou will see a student survey with 6 questions. This is a fictitious survey that I see y each of the 46,000 fictitious students at StatCrunch U. elow the survey you can set the sample size. Set this to 100 and click Genera oreadsheet will appear with the survey results for your random sample of 10 catCrunchU students. ote: Your sample is a random sample; therefore, your results will differ some ther students' results. ustructions for the lab assignment: How many females are in your sample? How many males? What proportio sample is female? What proportion of your sample is male? (StatCrunch st Tables, Frequency) Is there an equal proportion of men and women at StatCrunchU? а) Show that the conditions are met for the use of a normal model for test (np 2 10 and n(1- p) 2 10, where p is from the null hypothesis). b) Use StatCrunch to test the claim that the proportion of females at S equal to the proportion of men. Paste the StatCrunch printout below. (§ steps: Stat, Proportion Stats, One Sample, With Data. To copy click on C c) Write a conclusion to your hypothesis test referring to females at StatCr d) Explain what the P-value means as a probability that refers to random s 100 StatCrunchU students. What are the proportions of females and males at StatCrunchU? a) Show that the conditions are met for the use of a normal model for a co interval (count of successes and failures are greater than 10).

Glencoe Algebra 1, Student Edition, 9780079039897, 0079039898, 2018
18th Edition
ISBN:9780079039897
Author:Carter
Publisher:Carter
Chapter10: Statistics
Section10.5: Comparing Sets Of Data
Problem 26PFA

Related questions
Question
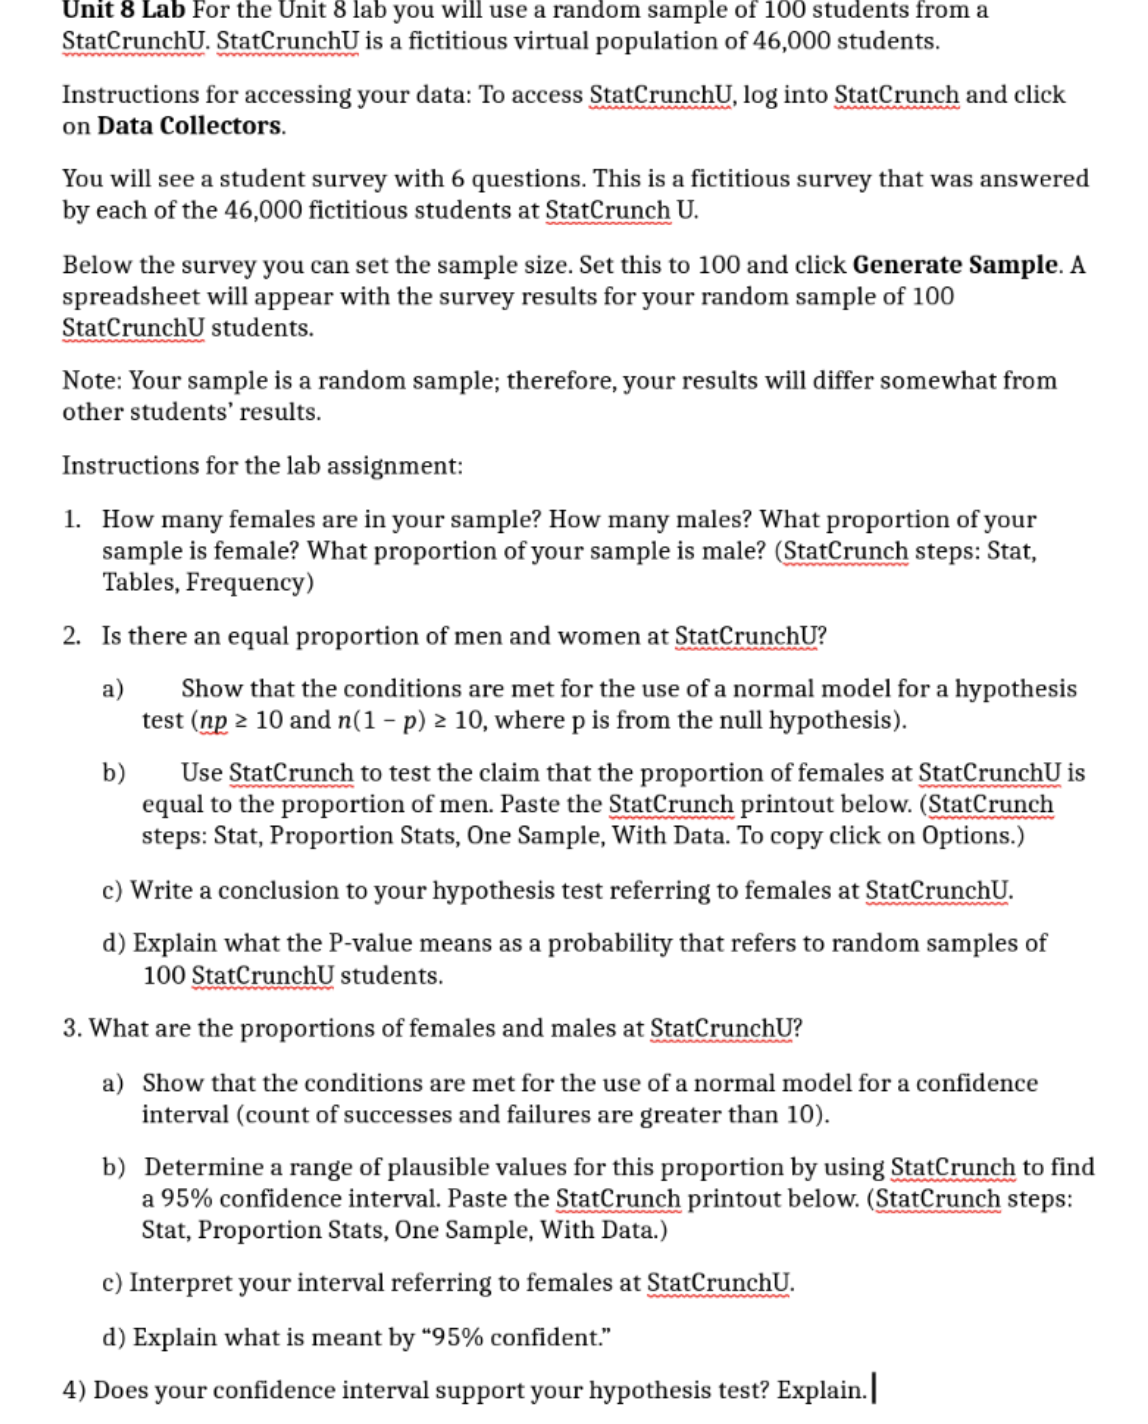
Transcribed Image Text:Unit 8 Lab For the Unit 8 lab you will use a random sample of 100 students from a
StatCrunchU. StatCrunchU is a fictitious virtual population of 46,000 students.
Instructions for accessing your data: To access StatCrunchU, log into StatCrunch and click
on Data Collectors.
You will see a student survey with 6 questions. This is a fictitious survey that was answered
by each of the 46,000 fictitious students at StatCrunch U.
Below the survey you can set the sample size. Set this to 100 and click Generate Sample. A
spreadsheet will appear with the survey results for your random sample of 100
StatCrunchU students.
Note: Your sample is a random sample; therefore, your results will differ somewhat from
other students' results.
Instructions for the lab assignment:
1. How many females are in your sample? How many males? What proportion of your
sample is female? What proportion of your sample is male? (StatCrunch steps: Stat,
Tables, Frequency)
2. Is there an equal proportion of men and women at StatCrunchU?
a)
Show that the conditions are met for the use of a normal model for a hypothesis
test (np 2 10 and n(1- p) 2 10, where p is from the null hypothesis).
b)
Use StatCrunch to test the claim that the proportion of females at StatCrunchU is
equal to the proportion of men. Paste the StatCrunch printout below. (StatCrunch
steps: Stat, Proportion Stats, One Sample, With Data. To copy click on Options.)
c) Write a conclusion to your hypothesis test referring to females at StatCrunchU.
d) Explain what the P-value means as a probability that refers to random samples of
100 StatCrunchU students.
3. What are the proportions of females and males at StatCrunchU?
a) Show that the conditions are met for the use of a normal model for a confidence
interval (count of successes and failures are greater than 10).
b) Determine a range of plausible values for this proportion by using StatCrunch to find
a 95% confidence interval. Paste the StatCrunch printout below. (StatCrunch steps:
Stat, Proportion Stats, One Sample, With Data.)
c) Interpret your interval referring to females at StatCrunchU.
d) Explain what is meant by “95% confident."
4) Does your confidence interval support your hypothesis test? Explain.
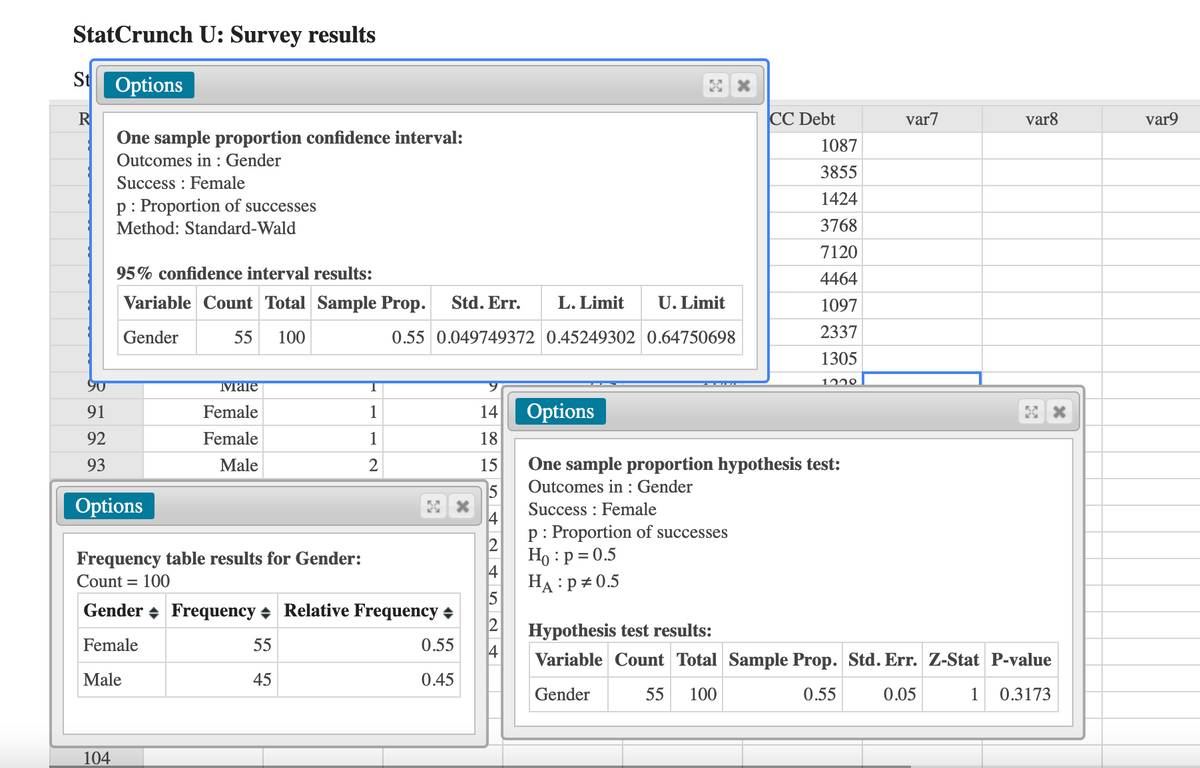
Transcribed Image Text:StatCrunch U: Survey results
St
Options
CC Debt
R
One sample proportion confidence interval:
Outcomes in : Gender
Success : Female
p: Proportion of successes
var7
var8
var9
1087
3855
1424
Method: Standard-Wald
3768
7120
95% confidence interval results:
4464
Variable Count Total Sample Prop.
Std. Err.
L. Limit
U. Limit
1097
Gender
55
100
0.55 0.049749372 0.45249302 0.64750698
2337
1305
1229.
90
Maie
91
Female
1
14
Options
92
Female
1
18
One sample proportion hypothesis test:
Outcomes in : Gender
93
Male
2
15
Options
5
Success : Female
4
p: Proportion of successes
Ho :p = 0.5
HA :p+ 0.5
Frequency table results for Gender:
Count = 100
Gender + Frequency + Relative Frequency +
Hypothesis test results:
Female
55
0.55
Variable Count Total Sample Prop. Std. Err. Z-Stat P-value
Male
45
0.45
Gender
55
100
0.55
0.05
1
0.3173
104
Expert Solution
This question has been solved!
Explore an expertly crafted, step-by-step solution for a thorough understanding of key concepts.

This is a popular solution!

Trending now
This is a popular solution!

Step by step
Solved in 2 steps with 2 images

Follow-up Questions
Read through expert solutions to related follow-up questions below.
Follow-up Question
4) Does your confidence interval support your hypothesis test? Explain.
Solution
Recommended textbooks for you
Glencoe Algebra 1, Student Edition, 9780079039897…
Algebra
ISBN:
9780079039897
Author:
Carter
Publisher:
McGraw Hill

Big Ideas Math A Bridge To Success Algebra 1: Stu…
Algebra
ISBN:
9781680331141
Author:
HOUGHTON MIFFLIN HARCOURT
Publisher:
Houghton Mifflin Harcourt

Holt Mcdougal Larson Pre-algebra: Student Edition…
Algebra
ISBN:
9780547587776
Author:
HOLT MCDOUGAL
Publisher:
HOLT MCDOUGAL
Glencoe Algebra 1, Student Edition, 9780079039897…
Algebra
ISBN:
9780079039897
Author:
Carter
Publisher:
McGraw Hill
Big Ideas Math A Bridge To Success Algebra 1: Stu…
Algebra
ISBN:
9781680331141
Author:
HOUGHTON MIFFLIN HARCOURT
Publisher:
Houghton Mifflin Harcourt
Holt Mcdougal Larson Pre-algebra: Student Edition…
Algebra
ISBN:
9780547587776
Author:
HOLT MCDOUGAL
Publisher:
HOLT MCDOUGAL