Outlet Deluxe Standard 1 39 27 38 28 44 36 4 38 30 40 30 6 39 35 7 34 29 (a) The manufacturer's suggested retail prices for the two models show a $10 price differential. Use a 0.05 level of sig is $10. State the null and alternative hypotheses. (Use Ha = mean price for the deluxe model – mean price for the standa O Ho: Hg# 10 Hai Hd = 10 Ho: Hg> 10 Hoi Hgs 10 Ho: Hg = 10 Ha: Ho* 10 O Ho: Ha = 10 H: Ha s 10 O H.: u.< 10 2.
Outlet Deluxe Standard 1 39 27 38 28 44 36 4 38 30 40 30 6 39 35 7 34 29 (a) The manufacturer's suggested retail prices for the two models show a $10 price differential. Use a 0.05 level of sig is $10. State the null and alternative hypotheses. (Use Ha = mean price for the deluxe model – mean price for the standa O Ho: Hg# 10 Hai Hd = 10 Ho: Hg> 10 Hoi Hgs 10 Ho: Hg = 10 Ha: Ho* 10 O Ho: Ha = 10 H: Ha s 10 O H.: u.< 10 2.

Big Ideas Math A Bridge To Success Algebra 1: Student Edition 2015
1st Edition
ISBN:9781680331141
Author:HOUGHTON MIFFLIN HARCOURT
Publisher:HOUGHTON MIFFLIN HARCOURT
Chapter4: Writing Linear Equations
Section: Chapter Questions
Problem 11CT

Related questions
Topic Video
Question
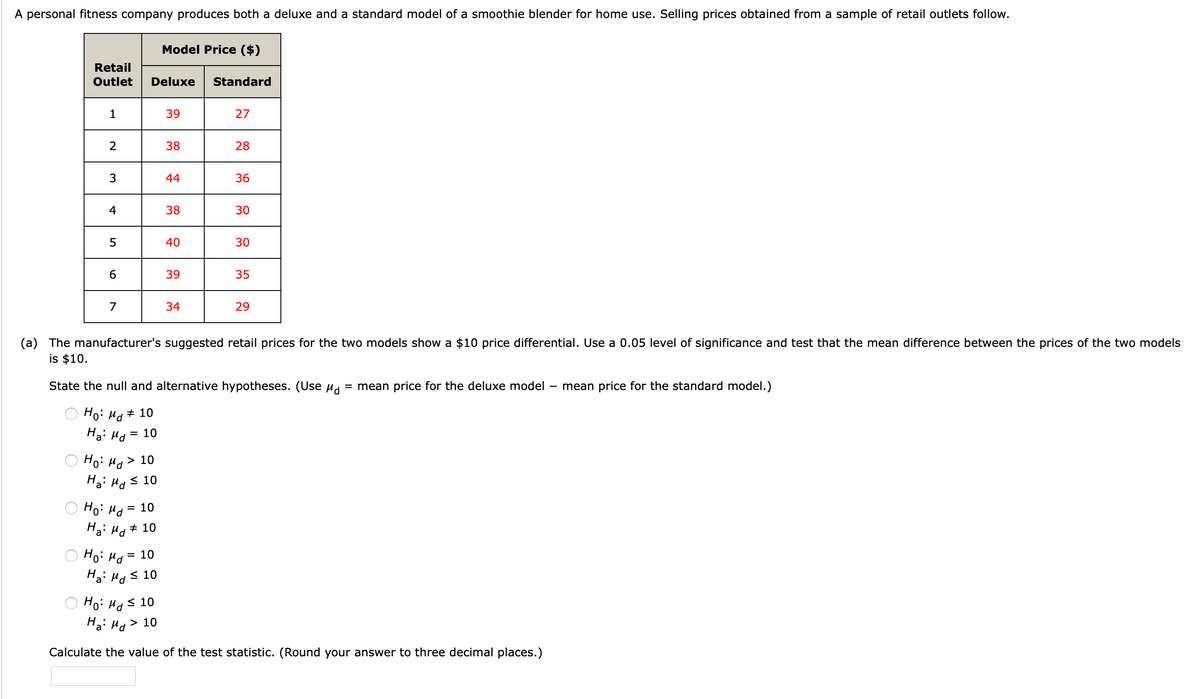
Transcribed Image Text:A personal fitness company produces both a deluxe and a standard model of a smoothie blender for home use. Selling prices obtained from a sample of retail outlets follow.
Model Price ($)
Retail
Outlet
Deluxe
Standard
1
39
27
2
38
28
3
44
36
4
38
30
5
40
30
39
35
7
34
29
(a) The manufacturer's suggested retail prices for the two models show a $10 price differential. Use a 0.05 level of significance and test that the mean difference between the prices of the two models
is $10.
State the null and alternative hypotheses. (Use ud
= mean price for the deluxe model
mean price for the standard model.)
Ho: Ha+ 10
Ha: Hd
10
Hoi Hd>
Ha: Hd
> 10
< 10
Hoi Hd
= 10
Ha: Ha + 10
10
%3D
Ha: Hgs 10
Ho: Ha s 10
Ha: Ha > 10
Calculate the value of the test statistic. (Round your answer to three decimal places.)
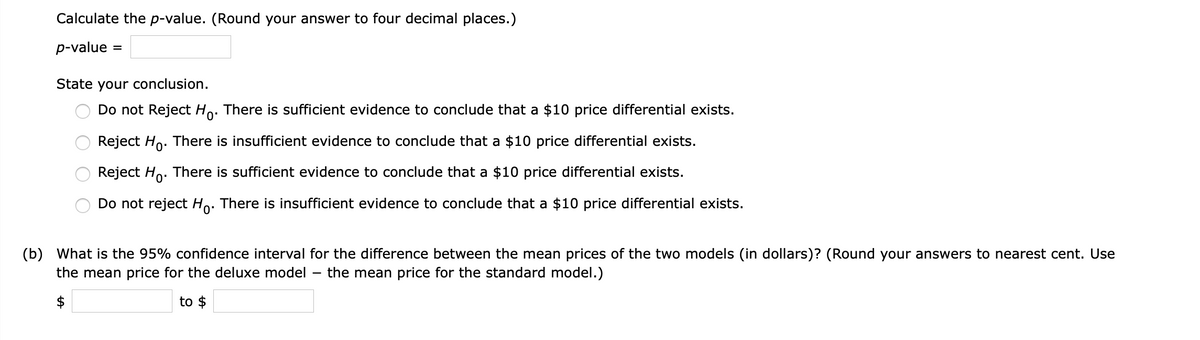
Transcribed Image Text:Calculate the p-value. (Round your answer to four decimal places.)
p-value
%3D
State your conclusion.
Do not Reject Ho. There is sufficient evidence to conclude that a $10 price differential exists.
Reject Ho. There is insufficient evidence to conclude that a $10 price differential exists.
Reject Ho.
There is sufficient evidence to conclude that a $10 price differential exists.
Do not reject Ho. There is insufficient evidence to conclude that a $10 price differential exists.
(b) What is the 95% confidence interval for the difference between the mean prices of the two models (in dollars)? (Round your answers to nearest cent. Use
the mean price for the deluxe model
the mean price for the standard model.)
$
to $
Expert Solution
This question has been solved!
Explore an expertly crafted, step-by-step solution for a thorough understanding of key concepts.

This is a popular solution!

Trending now
This is a popular solution!

Step by step
Solved in 4 steps with 5 images

Knowledge Booster


Learn more about
Need a deep-dive on the concept behind this application? Look no further. Learn more about this topic, statistics and related others by exploring similar questions and additional content below.Recommended textbooks for you
Big Ideas Math A Bridge To Success Algebra 1: Stu…
Algebra
ISBN:
9781680331141
Author:
HOUGHTON MIFFLIN HARCOURT
Publisher:
Houghton Mifflin Harcourt

Glencoe Algebra 1, Student Edition, 9780079039897…
Algebra
ISBN:
9780079039897
Author:
Carter
Publisher:
McGraw Hill
Big Ideas Math A Bridge To Success Algebra 1: Stu…
Algebra
ISBN:
9781680331141
Author:
HOUGHTON MIFFLIN HARCOURT
Publisher:
Houghton Mifflin Harcourt
Glencoe Algebra 1, Student Edition, 9780079039897…
Algebra
ISBN:
9780079039897
Author:
Carter
Publisher:
McGraw Hill