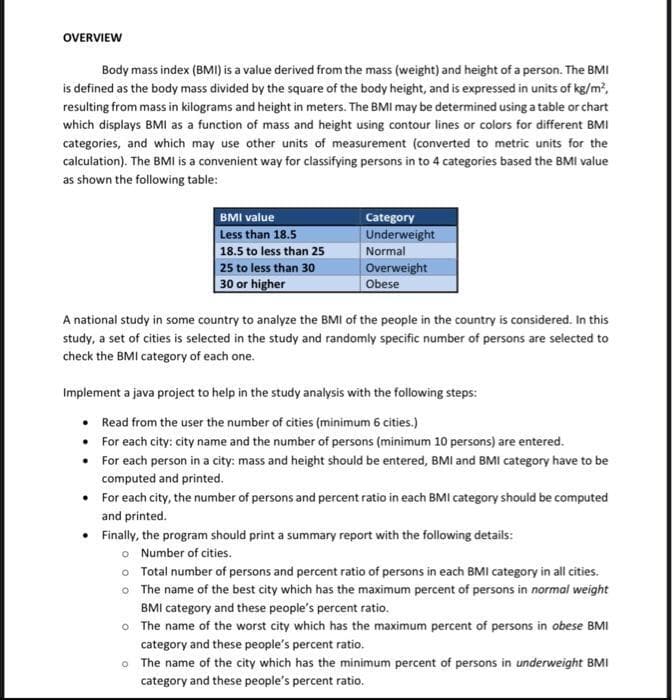
OVERVIEW Body mass index (BMI) is a value derived from the mass (weight) and height of a person. The BMI is defined as the body mass divided by the square of the body height, and is expressed in units of kg/m?, resulting from mass in kilograms and height in meters. The BMi may be determined using a table or chart which displays BMI as a function of mass and height using contour lines or colors for different BMI categories, and which may use other units of measurement (converted to metric units for the calculation). The BMI is a convenient way for classifying persons in to 4 categories based the BMI value as shown the following table: BMI value Less than 18.5 18.5 to less than 25 25 to less than 30 30 or higher Category Underweight Normal Overweight Obese A national study in some country to analyze the BMI of the people in the country is considered. In this study, a set of cities is selected in the study and randomly specific number of persons are selected to check the BMI category of each one. Implement a java project to help in the study analysis with the following steps: Read from the user the number of cities (minimum 6 cities.) • For each city: city name and the number of persons (minimum 10 persons) are entered. • For each person in a city: mass and height should be entered, BMI and BMI category have to be computed and printed. • For each city, the number of persons and percent ratio in each BMI category should be computed and printed. • Finally, the program should print a summary report with the following details: o Number of cities. o Total number of persons and percent ratio of persons in each BMI category in all cities. o The name of the best city which has the maximum percent of persons in normal weight BMI category and these people's percent ratio. o The name of the worst city which has the maximum percent of persons in obese BMI category and these people's percent ratio. • The name of the city which has the minimum percent of persons in underweight BMI category and these people's percent ratio.
OVERVIEW Body mass index (BMI) is a value derived from the mass (weight) and height of a person. The BMI is defined as the body mass divided by the square of the body height, and is expressed in units of kg/m?, resulting from mass in kilograms and height in meters. The BMi may be determined using a table or chart which displays BMI as a function of mass and height using contour lines or colors for different BMI categories, and which may use other units of measurement (converted to metric units for the calculation). The BMI is a convenient way for classifying persons in to 4 categories based the BMI value as shown the following table: BMI value Less than 18.5 18.5 to less than 25 25 to less than 30 30 or higher Category Underweight Normal Overweight Obese A national study in some country to analyze the BMI of the people in the country is considered. In this study, a set of cities is selected in the study and randomly specific number of persons are selected to check the BMI category of each one. Implement a java project to help in the study analysis with the following steps: Read from the user the number of cities (minimum 6 cities.) • For each city: city name and the number of persons (minimum 10 persons) are entered. • For each person in a city: mass and height should be entered, BMI and BMI category have to be computed and printed. • For each city, the number of persons and percent ratio in each BMI category should be computed and printed. • Finally, the program should print a summary report with the following details: o Number of cities. o Total number of persons and percent ratio of persons in each BMI category in all cities. o The name of the best city which has the maximum percent of persons in normal weight BMI category and these people's percent ratio. o The name of the worst city which has the maximum percent of persons in obese BMI category and these people's percent ratio. • The name of the city which has the minimum percent of persons in underweight BMI category and these people's percent ratio.

COMPREHENSIVE MICROSOFT OFFICE 365 EXCE
1st Edition
ISBN:9780357392676
Author:FREUND, Steven
Publisher:FREUND, Steven
Chapter5: Working With Multiple Worksheets And Workbooks
Section: Chapter Questions
Problem 4AYK

Related questions
Question
answer for this without arrays and please every time i get answers this ouput doesn't work as i need
Transcribed Image Text:OVERVIEW
Body mass index (BMI) is a value derived from the mass (weight) and height of a person. The BMI
is defined as the body mass divided by the square of the body height, and is expressed in units of kg/m,
resulting from mass in kilograms and height in meters. The BMI may be determined using a table or chart
which displays BMI as a function of mass and height using contour lines or colors for different BMI
categories, and which may use other units of measurement (converted to metric units for the
calculation). The BMI is a convenient way for classifying persons in to 4 categories based the BMI value
as shown the following table:
BMI value
Category
Less than 18.5
Underweight
18.5 to less than 25
Normal
Overweight
Obese
25 to less than 30
30 or higher
A national study in some country to analyze the BMI of the people in the country is considered. In this
study, a set of cities is selected in the study and randomly specific number of persons are selected to
check the BMI category of each one.
Implement a java project to help in the study analysis with the following steps:
Read from the user the number of cities (minimum 6 cities.)
• For each city: city name and the number of persons (minimum 10 persons) are entered.
• For each person in a city: mass and height should be entered, BMI and BMI category have to be
computed and printed.
• For each city, the number of persons and percent ratio in each BMI category should be computed
and printed.
Finally, the program should print a summary report with the following details:
o Number of cities.
o Total number of persons and percent ratio of persons in each BMI category in all cities.
o The name of the best city which has the maximum percent of persons in normal weight
BMI category and these people's percent ratio.
O The name of the worst city which has the maximum percent of persons in obese BMI
category and these people's percent ratio.
o The name of the city which has the minimum percent of persons in underweight BMI
category and these people's percent ratio.
Expert Solution
This question has been solved!
Explore an expertly crafted, step-by-step solution for a thorough understanding of key concepts.

Step by step
Solved in 2 steps with 1 images

Knowledge Booster


Learn more about
Need a deep-dive on the concept behind this application? Look no further. Learn more about this topic, computer-science and related others by exploring similar questions and additional content below.Recommended textbooks for you
COMPREHENSIVE MICROSOFT OFFICE 365 EXCE
Computer Science
ISBN:
9780357392676
Author:
FREUND, Steven
Publisher:
CENGAGE L
Np Ms Office 365/Excel 2016 I Ntermed
Computer Science
ISBN:
9781337508841
Author:
Carey
Publisher:
Cengage
COMPREHENSIVE MICROSOFT OFFICE 365 EXCE
Computer Science
ISBN:
9780357392676
Author:
FREUND, Steven
Publisher:
CENGAGE L
Np Ms Office 365/Excel 2016 I Ntermed
Computer Science
ISBN:
9781337508841
Author:
Carey
Publisher:
Cengage