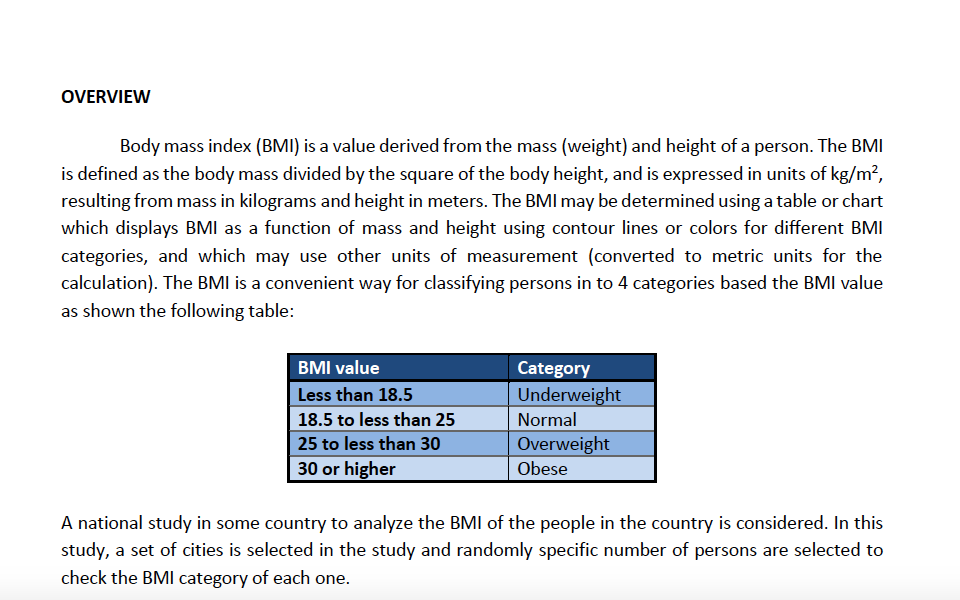
OVERVIEW Body mass index (BMI) is a value derived from the mass (weight) and height of a person. The BMI is defined as the body mass divided by the square of the body height, and is expressed in units of kg/m², resulting from mass in kilograms and height in meters. The BMI may be determined using a table or chart which displays BMI as a function of mass and height using contour lines or colors for different BMI categories, and which may use other units of measurement (converted to metric units for the calculation). The BMI is a convenient way for classifying persons in to 4 categories based the BMI value as shown the following table: BMI value Category Less than 18.5 Underweight Normal 18.5 to less than 25 Overweight Obese 25 to less than 30 30 or higher A national study in some country to analyze the BMI of the people in the country is considered. In this study, a set of cities is selected in the study and randomly specific number of persons are selected to check the BMI category of each one.
OVERVIEW Body mass index (BMI) is a value derived from the mass (weight) and height of a person. The BMI is defined as the body mass divided by the square of the body height, and is expressed in units of kg/m², resulting from mass in kilograms and height in meters. The BMI may be determined using a table or chart which displays BMI as a function of mass and height using contour lines or colors for different BMI categories, and which may use other units of measurement (converted to metric units for the calculation). The BMI is a convenient way for classifying persons in to 4 categories based the BMI value as shown the following table: BMI value Category Less than 18.5 Underweight Normal 18.5 to less than 25 Overweight Obese 25 to less than 30 30 or higher A national study in some country to analyze the BMI of the people in the country is considered. In this study, a set of cities is selected in the study and randomly specific number of persons are selected to check the BMI category of each one.

Computer Networking: A Top-Down Approach (7th Edition)
7th Edition
ISBN:9780133594140
Author:James Kurose, Keith Ross
Publisher:James Kurose, Keith Ross
Chapter1: Computer Networks And The Internet
Section: Chapter Questions
Problem R1RQ: What is the difference between a host and an end system? List several different types of end...

Related questions
Question
I want an answer for a begainer on Netbeans
Transcribed Image Text:OVERVIEW
Body mass index (BMI) is a value derived from the mass (weight) and height of a person. The BMI
is defined as the body mass divided by the square of the body height, and is expressed in units of kg/m2,
resulting from mass in kilograms and height in meters. The BMI may be determined using a table or chart
which displays BMI as a function of mass and height using contour lines or colors for different BMI
categories, and which may use other units of measurement (converted to metric units for the
calculation). The BMI is a convenient way for classifying persons in to 4 categories based the BMI value
as shown the following table:
BMI value
Category
Underweight
Normal
Overweight
Less than 18.5
18.5 to less than 25
25 to less than 30
30 or higher
Obese
A national study in some country to analyze the BMI of the people in the country is considered. In this
study, a set of cities is selected in the study and randomly specific number of persons are selected to
check the BMI category of each one.
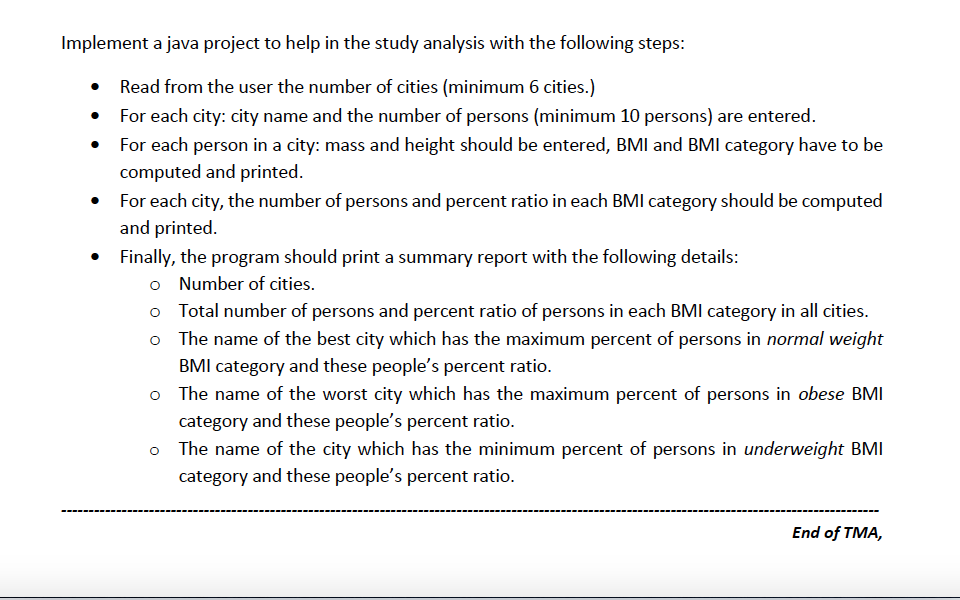
Transcribed Image Text:Implement a java project to help in the study analysis with the following steps:
Read from the user the number of cities (minimum 6 cities.)
For each city: city name and the number of persons (minimum 10 persons) are entered.
• For each person in a city: mass and height should be entered, BMI and BMI category have to be
computed and printed.
For each city, the number of persons and percent ratio in each BMI category should be computed
and printed.
Finally, the program should print a summary report with the following details:
o Number of cities.
o Total number of persons and percent ratio of persons in each BMI category in all cities.
o The name of the best city which has the maximum percent of persons in normal weight
BMI category and these people's percent ratio.
o The name of the worst city which has the maximum percent of persons in obese BMI
category and these people's percent ratio.
o The name of the city which has the minimum percent of persons in underweight BMI
category and these people's percent ratio.
End of TMA,
Expert Solution
This question has been solved!
Explore an expertly crafted, step-by-step solution for a thorough understanding of key concepts.

Step by step
Solved in 3 steps

Recommended textbooks for you
Computer Networking: A Top-Down Approach (7th Edi…
Computer Engineering
ISBN:
9780133594140
Author:
James Kurose, Keith Ross
Publisher:
PEARSON

Computer Organization and Design MIPS Edition, Fi…
Computer Engineering
ISBN:
9780124077263
Author:
David A. Patterson, John L. Hennessy
Publisher:
Elsevier Science

Network+ Guide to Networks (MindTap Course List)
Computer Engineering
ISBN:
9781337569330
Author:
Jill West, Tamara Dean, Jean Andrews
Publisher:
Cengage Learning
Computer Networking: A Top-Down Approach (7th Edi…
Computer Engineering
ISBN:
9780133594140
Author:
James Kurose, Keith Ross
Publisher:
PEARSON
Computer Organization and Design MIPS Edition, Fi…
Computer Engineering
ISBN:
9780124077263
Author:
David A. Patterson, John L. Hennessy
Publisher:
Elsevier Science
Network+ Guide to Networks (MindTap Course List)
Computer Engineering
ISBN:
9781337569330
Author:
Jill West, Tamara Dean, Jean Andrews
Publisher:
Cengage Learning

Concepts of Database Management
Computer Engineering
ISBN:
9781337093422
Author:
Joy L. Starks, Philip J. Pratt, Mary Z. Last
Publisher:
Cengage Learning

Prelude to Programming
Computer Engineering
ISBN:
9780133750423
Author:
VENIT, Stewart
Publisher:
Pearson Education

Sc Business Data Communications and Networking, T…
Computer Engineering
ISBN:
9781119368830
Author:
FITZGERALD
Publisher:
WILEY