Owners of Major League Baseball teams have been concerned with attendance in recent years as declines have been noticed across the board. There are a variety of factors that are causing this decline, but it is believed that a team's win-loss record, payroll, stadium age, and home run ability help to drive attendance. What was the average attendance per team in 2018? Round your answer to 3 decimal p What team had the highest and lowest total attendance in 2018? Enter the team names along with their attendance figures as they appear in the data file. Round your attendance numbers to 3 decima Team Attendance Highest attendance mil Lowest attendance mil


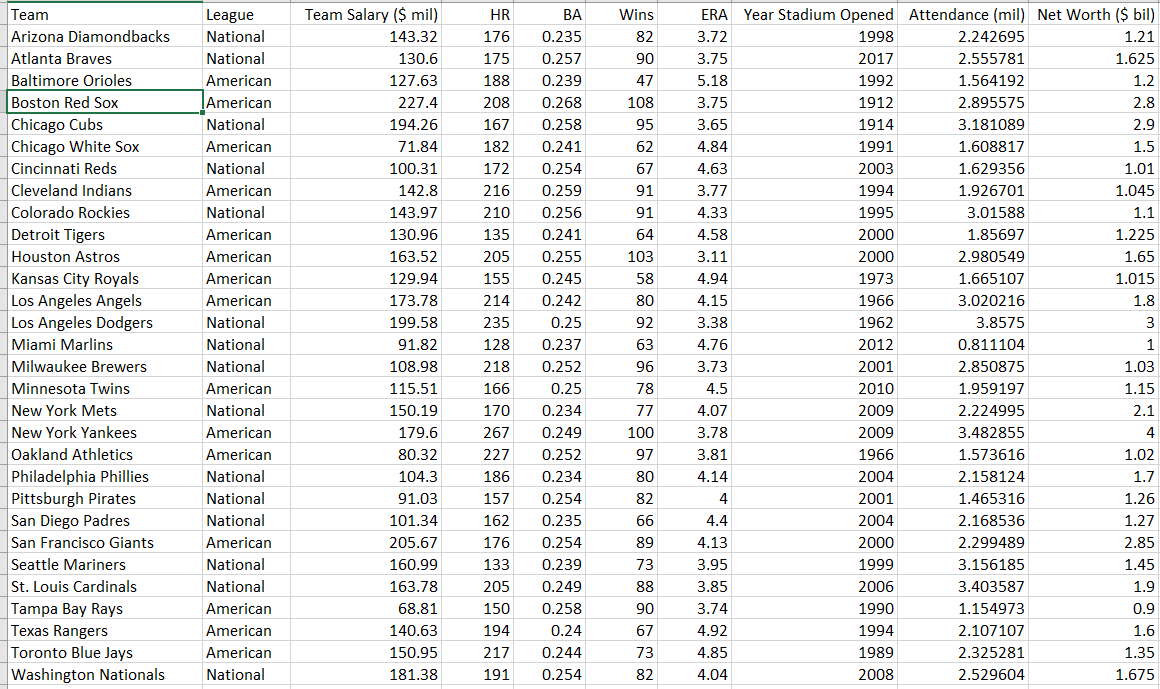
Owners of Major League Baseball teams have been concerned with attendance in recent years as declines have been noticed across the board. There are a variety of factors that are causing this decline, but it is believed that a team's win-loss record, payroll, stadium age, and home run ability help to drive attendance.
- What was the average attendance per team in 2018? Round your answer to 3 decimal p
- What team had the highest and lowest total attendance in 2018? Enter the team names along with their attendance figures as they appear in the data file. Round your attendance numbers to 3 decima
|
|
Team |
Attendance |
|
Highest attendance |
mil |
|
|
Lowest attendance |
mil |
- What was the range of attendance in 2018? Round your answer to 3 decimal places.
Let's look at attendance between the two leagues and draw some conclusions. For purposes parts D and E, we are assuming that separating the data into 2 groups based on League is considered sampling; thus, we have 2 samples (American League and National League) and assume we do NOT know the population standard deviations for both "populations" (we only have 1 overall population, not 2).
- What was the average attendance in each league? Round your answer to 3 decimal places.
|
American League average attendance |
mil |
|
National League average attendance |
mil |
- Perform a hypothesis test to determine whether there is a difference in the mean attendance of teams in the American League vs teams in the National League. Use a 0.05 level of significance in your testing procedures. Additionally:
- You will need to know the standard deviations and variances for attendance in each league to conduct this test.
- We are assuming that both American and National League attendance figures follow a
normal distribution . - American and National league data are samples; thus, the population standard deviations are unknown.
Hint: When calculating your pooled sample variance and your test statistic, assume the American League data is sample 1 and the National League data is sample 2.
|
Decision Rule |
-t < or t > = REJECT H0 |
|
Value of Pooled Sample Variances |
|
|
Value of test statistic |
|
|
Decision: enter Reject or Do Not Reject |
Is there a difference in the mean attendance of teams in the American League vs. teams in the National League assuming a 0.05 level of significance? Enter Yes or No.
Another idea is to look at how a team's payroll impacts its home attendance. Higher payroll usually signals more higher-skilled players on a roster which should brings fans to the ballpark to see these players.
- Create 2 samples based on Team Salary and calculate average attendance, variance of attendance, and standard deviation of attendance for each sample.
- Sample 1 = 10 teams with the highest team salary
- Sample 2 = 10 teams with the lowest team salary
|
|
Sample 1 |
Sample 2 |
|
|
Top 10 Team Salary |
Bottom 10 Team Salary |
|
Sample mean attendance |
mil |
mil |
|
Sample attendance variance |
mil |
mil |
|
Sample attendance standard deviation |
mil |
mil |
- Perform a hypothesis test to determine whether there is a difference in the mean attendance of teams between the two groups created in Part F. Use a 0.05 level of significance in your testing procedures.
Hint: When calculating your pooled sample variance and your test statistic, assume the Top 10 data is sample 1 and the Bottom 10 data is sample 2.
|
Decision Rule |
-t < or t > = REJECT H0 |
|
Value of Pooled Sample Variances |
|
|
Value of test statistic |
|
|
Decision: enter Reject or Do Not Reject |
Is there a difference in the mean attendance between the two groups assuming a 0.05 level of significance? Enter Yes or No.
Another variable that can impact attendance is the team's win-loss record. Teams that are winning more games are thought to have increased attendance as fans prefer to see their home team "win" rather than "lose" (although for some teams such as the Chicago Cubs, this is not always an established relationship!).
- Create 2 samples based on Wins and calculate average wins, wins variance, and wins standard deviation for each sample.
- Sample 1 = 10 teams with the highest wins
- Sample 2 = 10 teams with the lowest wins
|
|
Sample 1 |
Sample 2 |
|
|
Top 10 Wins |
Bottom 10 Wins |
|
Sample mean attendance |
mil |
mil |
|
Sample attendance variance |
mil |
mil |
|
Sample attendance standard deviation |
mil |
mil |
- Perform a hypothesis test to determine whether there is a difference in the mean attendance of teams between the two groups created in Part H. Use a 0.05 level of significance in your testing procedures.
Hint: When calculating your pooled sample variance and your test statistic, assume the Top 10 data is sample 1 and the Bottom 10 data is sample 2.
|
Decision Rule |
-t < or t > = REJECT H0 |
|
Value of Pooled Sample Variances |
|
|
Value of test statistic |
|
|
Decision: enter Reject or Do Not Reject |
Is there a difference in the mean attendance between the two groups assuming a 0.05 level of significance? Enter Yes or No.


Trending now
This is a popular solution!

Step by step
Solved in 3 steps with 2 images


