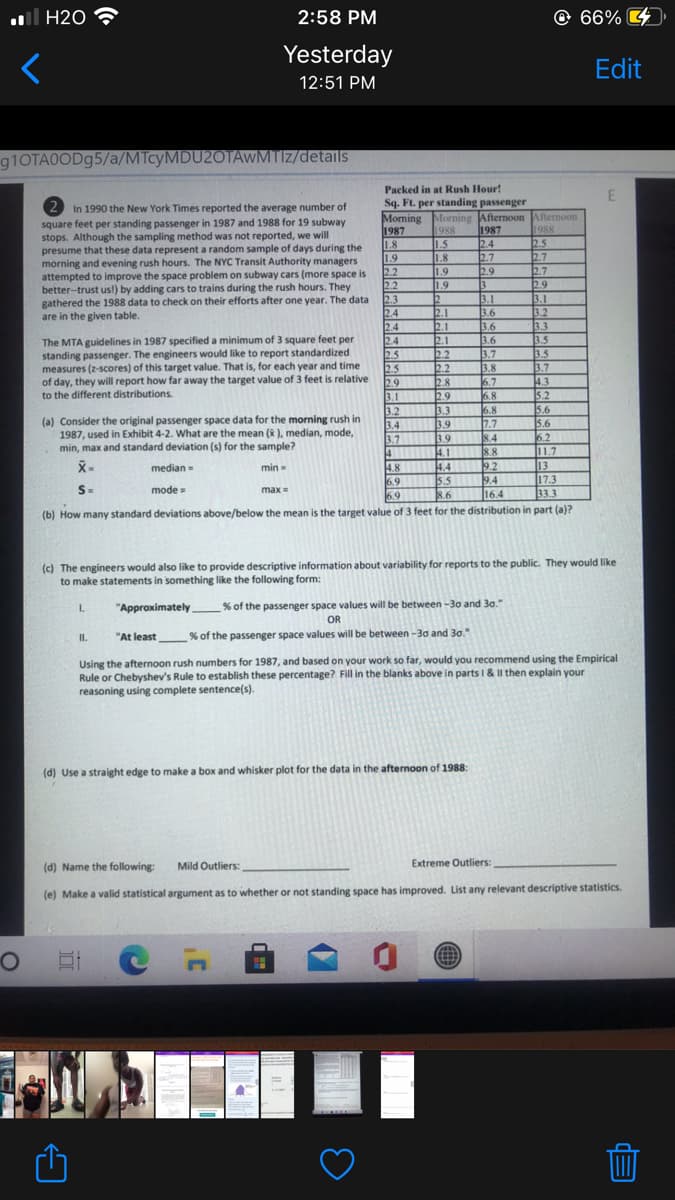
Packed in at Rush Hour! Sq. Ft. per standing passenger In 1990 the New York Times reported the average number of square feet per standing passenger in 1987 and 1988 for 19 subway stops. Although the sampling method was not reported, we will presume that these data represent a random sample of days during the morning and evening rush hours. The NYC Transit Authority managers attempted to improve the space problem on subway cars (more space is better-trust usl) by adding cars to trains during the rush hours. They Moming Morning Afternoon Afternoon 1988 25 2.7 2.7 2.9 3.1 3.2 3.3 3.5 3.5 3.7 4.3 5.2 5.6 5.6 62 11.7 13 17.3 333 1987 1.8 1.9 22 22 23 1988 1.5 1.8 1.9 1.9 1987 24 2.7 29 gathered the 1988 data to check on their efforts after one year. The data 2.4 24 2.4 25 2.5 of day, they will report how far away the target value of 3 feet is relative 3.1 3.6 3.6 3.6 3.7 3.8 5.7 6.8 5.8 7.7 84 88 are in the given table. 2.1 2.1 22 22 2.8 2.9 3.3 3.9 3.9 The MTA guidelines in 1987 specified a minimum of 3 square feet per standing passenger. The engineers would like to report standardized measures (2-scores) of this target value. That is, for each year and time 29 3.1 3.2 3.4 3.7|| to the different distributions. (a) Consider the original passenger space data for the morning rush in 1987, used in Exhibit 4-2. What are the mean (k), median, mode, min, max and standard deviation (s) for the sample? min 4.8 44 6.9 55 median - S- mode 9.4 16.4 max 69 8.6 (b) How many standard deviations above/below the mean is the target value of 3 feet for the distribution in part (a)? (c) The engineers would also like to provide descriptive information about variability for reports to the public. They would like to make statements in something like the following form: "Approximately _% of the passenger space values will be between -3o and 30." OR L. I. "At least % of the passenger space values will be between -30 and 30. Using the afternoon rush numbers for 1987, and based on your work so far, would you recommend using the Empirical Rule or Chebyshev's Rule to establish these percentage? Fill in the blanks above in parts i& I then explain your reasoning using complete sentence(s). (d) Use a straight edge to make a box and whisker plot for the data in the afternoon of 1988: (d) Name the following Mild Outliers: Extreme Outliers:

Linear Algebra: A Modern Introduction
4th Edition
ISBN:9781285463247
Author:David Poole
Publisher:David Poole
Chapter4: Eigenvalues And Eigenvectors
Section4.6: Applications And The Perron-frobenius Theorem
Problem 25EQ
icon
Related questions
icon
Concept explainers
Topic Video
Question
Answer only d,d,e
H2O
2:58 PM
@ 66% 4
Yesterday
Edit
12:51 PM
91OTA0OD95/a/MTcyMDU2OTAwMTIz/details
Packed in at Rush Hour!
Sq. Ft. per standing passenger
Moming Morning Afternoon Aftemoon
1987
1.8
1.9
2.2
2.2
2.3
2.4
2.4
2.4
2.5
2.5
29
3.1
3.2
3.4
3.7
4
4.8
6.9
6.9
In 1990 the New York Times reported the average number of
square feet per standing passenger in 1987 and 1988 for 19 subway
stops. Although the sampling method was not reported, we will
presume that these data represent a random sample of days during the
morning and evening rush hours. The NYC Transit Authority managers
attempted to improve the space problem on subway cars (more space is
better-trust us!) by adding cars to trains during the rush hours. They
gathered the 1988 data to check on their efforts after one year. The data
are in the given table.
1987
2.4
2.7
2.9
3
3.1
3.6
3.6
3.6
3.7
3.8
6.7
|6.8
6.8
7.7
8.4
8.8
9.2
9.4
16.4
1988
1988
2.5
2.7
2.7
2.9
3.1
3.2
3.3
3.5
3.5
3.7
4.3
5.2
5.6
5.6
6.2
11.7
13
17.3
33.3
1.5
1.8
1.9
1.9
2.
2.1
2.1
2.1
2.2
2.2
2.8
2.9
3.3
3.9
3.9
4.1
4.4
5.5
8.6
The MTA guidelines in 1987 specified a minimum of 3 square feet per
standing passenger. The engineers would like to report standardized
measures (z-scores) of this target value. That is, for each year and time
of day, they will report how far away the target value of 3 feet is relative
to the different distributions.
(a) Consider the original passenger space data for the morning rush in
1987, used in Exhibit 4-2. What are the mean (& ), median, mode,
min, max and standard deviation (s) for the sample?
median =
min
S-
mode
max
=
(b) How many standard deviations above/below the mean is the target value of 3 feet for the distribution in part (a)?
(c) The engineers would also like to provide descriptive information about variability for reports to the public. They would like
to make statements in something like the following form:
1.
"Approximately
% of the passenger space values will be between -30 and 3a."
OR
"At least
% of the passenger space values will be between -3o and 30."
II.
Using the afternoon rush numbers for 1987, and based on your work so far, would you recommend using the Empirical
Rule or Chebyshev's Rule to establish these percentage? Fill in the blanks above in parts I & II then explain your
reasoning using complete sentence(s).
(d) Use a straight edge to make a box and whisker plot for the data in the afternoon of 1988:
(d) Name the following:
Mild Outliers:
Extreme Outliers:
(e) Make a valid statistical argument as to whether or not standing space has improved. List any relevant descriptive statistics.
曲)
Transcribed Image Text:H2O 2:58 PM @ 66% 4 Yesterday Edit 12:51 PM 91OTA0OD95/a/MTcyMDU2OTAwMTIz/details Packed in at Rush Hour! Sq. Ft. per standing passenger Moming Morning Afternoon Aftemoon 1987 1.8 1.9 2.2 2.2 2.3 2.4 2.4 2.4 2.5 2.5 29 3.1 3.2 3.4 3.7 4 4.8 6.9 6.9 In 1990 the New York Times reported the average number of square feet per standing passenger in 1987 and 1988 for 19 subway stops. Although the sampling method was not reported, we will presume that these data represent a random sample of days during the morning and evening rush hours. The NYC Transit Authority managers attempted to improve the space problem on subway cars (more space is better-trust us!) by adding cars to trains during the rush hours. They gathered the 1988 data to check on their efforts after one year. The data are in the given table. 1987 2.4 2.7 2.9 3 3.1 3.6 3.6 3.6 3.7 3.8 6.7 |6.8 6.8 7.7 8.4 8.8 9.2 9.4 16.4 1988 1988 2.5 2.7 2.7 2.9 3.1 3.2 3.3 3.5 3.5 3.7 4.3 5.2 5.6 5.6 6.2 11.7 13 17.3 33.3 1.5 1.8 1.9 1.9 2. 2.1 2.1 2.1 2.2 2.2 2.8 2.9 3.3 3.9 3.9 4.1 4.4 5.5 8.6 The MTA guidelines in 1987 specified a minimum of 3 square feet per standing passenger. The engineers would like to report standardized measures (z-scores) of this target value. That is, for each year and time of day, they will report how far away the target value of 3 feet is relative to the different distributions. (a) Consider the original passenger space data for the morning rush in 1987, used in Exhibit 4-2. What are the mean (& ), median, mode, min, max and standard deviation (s) for the sample? median = min S- mode max = (b) How many standard deviations above/below the mean is the target value of 3 feet for the distribution in part (a)? (c) The engineers would also like to provide descriptive information about variability for reports to the public. They would like to make statements in something like the following form: 1. "Approximately % of the passenger space values will be between -30 and 3a." OR "At least % of the passenger space values will be between -3o and 30." II. Using the afternoon rush numbers for 1987, and based on your work so far, would you recommend using the Empirical Rule or Chebyshev's Rule to establish these percentage? Fill in the blanks above in parts I & II then explain your reasoning using complete sentence(s). (d) Use a straight edge to make a box and whisker plot for the data in the afternoon of 1988: (d) Name the following: Mild Outliers: Extreme Outliers: (e) Make a valid statistical argument as to whether or not standing space has improved. List any relevant descriptive statistics. 曲)
Expert Solution
trending now

Trending now

This is a popular solution!

steps

Step by step

Solved in 3 steps with 1 images

Blurred answer
Knowledge Booster
Sample space, Events, and Basic Rules of Probability
Learn more about
Need a deep-dive on the concept behind this application? Look no further. Learn more about this topic, statistics and related others by exploring similar questions and additional content below.
Recommended textbooks for you
Linear Algebra: A Modern Introduction
Algebra
ISBN:
9781285463247
Author:
David Poole
Publisher:
Cengage Learning
Algebra & Trigonometry with Analytic Geometry
Algebra
ISBN:
9781133382119
Author:
Swokowski
Publisher:
Cengage
College Algebra
College Algebra
Algebra
ISBN:
9781938168383
Author:
Jay Abramson
Publisher:
OpenStax