pal temperature increases are benchmarked to the average temp perature was 0.72°C above the benchmark. In 2020, it was 1.02° mate.nasa.gov, accessed March 23, 2021. Your answer is partially correct.
pal temperature increases are benchmarked to the average temp perature was 0.72°C above the benchmark. In 2020, it was 1.02° mate.nasa.gov, accessed March 23, 2021. Your answer is partially correct.

Chapter6: Exponential And Logarithmic Functions
Section6.8: Fitting Exponential Models To Data
Problem 3TI: Table 6 shows the population, in thousands, of harbor seals in the Wadden Sea over the years 1997 to...

Related questions
Question
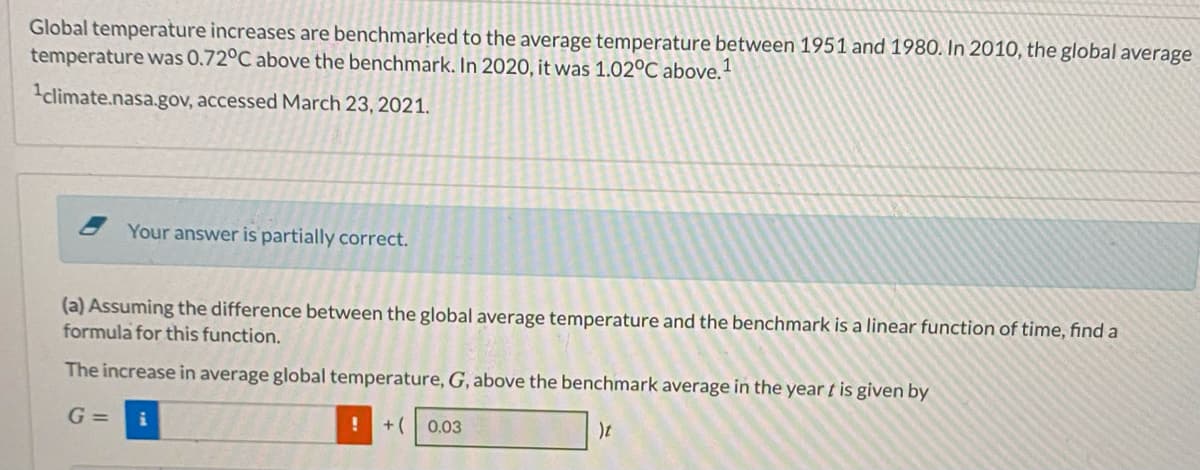
Transcribed Image Text:Global temperature increases are benchmarked to the average temperature between 1951 and 1980. In 2010, the global average
temperature was 0.72°C above the benchmark. In 2020, it was 1.02°C above.
climate.nasa.gov, accessed March 23, 2021.
Your answer is partially correct.
(a) Assuming the difference between the global average temperature and the benchmark is a linear function of time, find a
formula for this function.
The increase in average global temperature, G, above the benchmark average in the year t is given by
G =
+( 0.03
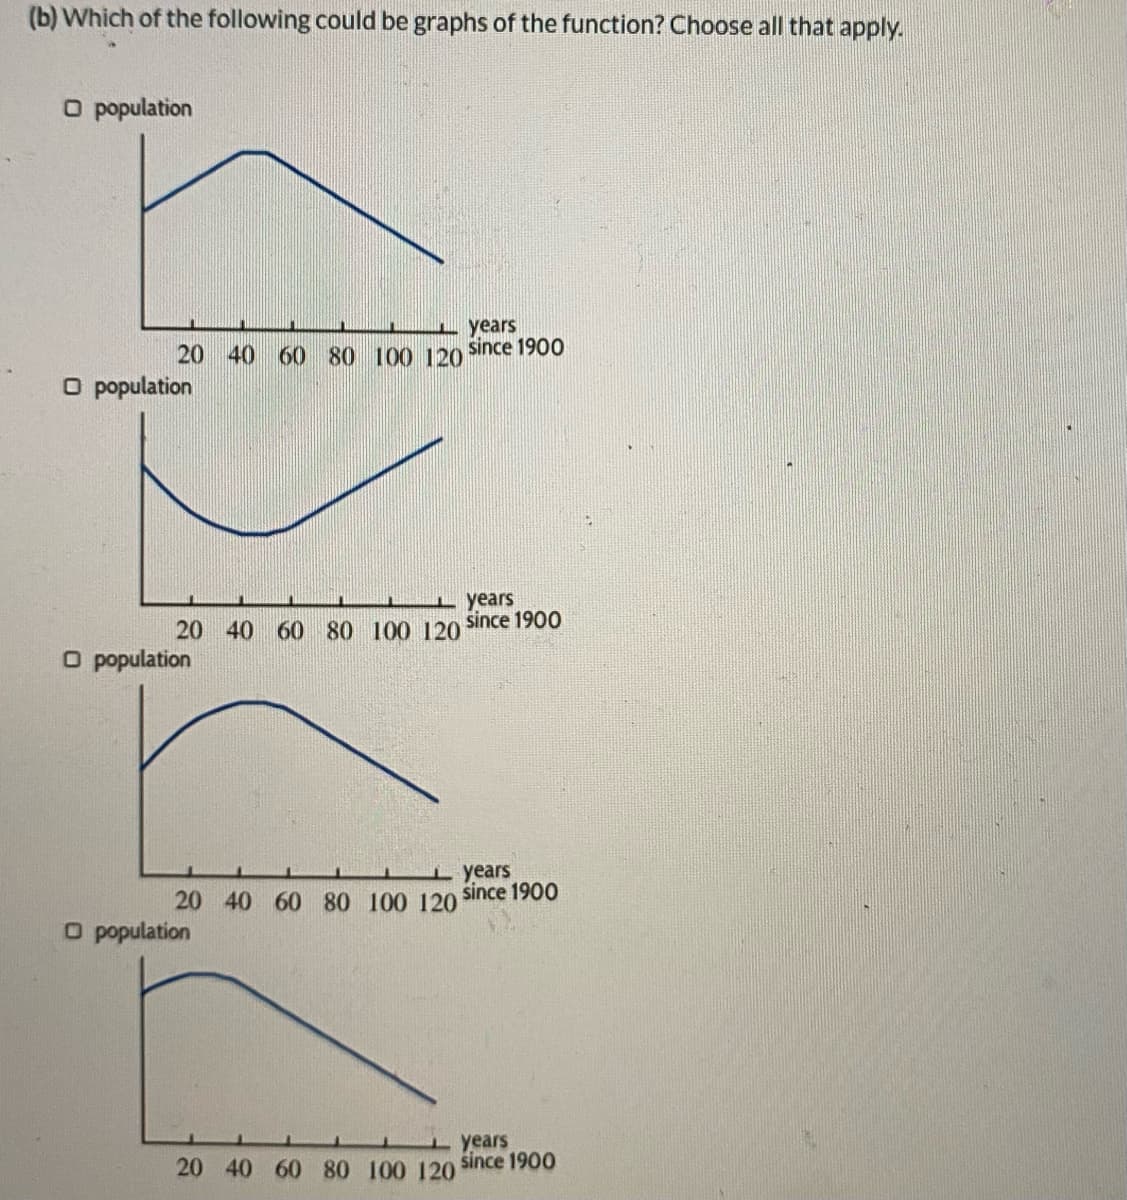
Transcribed Image Text:(b) Which of the following could be graphs of the function? Choose all that apply.
O population
years
20 40 60 80 100 120
since 1900
O population
I years
since 1900
20 40 60 80 100 120
O population
i years
20 40 60 80 100 120
since 1900
O population
years
20 40 60 80 100 120 since 1900
Expert Solution
This question has been solved!
Explore an expertly crafted, step-by-step solution for a thorough understanding of key concepts.

This is a popular solution!

Trending now
This is a popular solution!

Step by step
Solved in 4 steps with 1 images

Recommended textbooks for you

Elementary Linear Algebra (MindTap Course List)
Algebra
ISBN:
9781305658004
Author:
Ron Larson
Publisher:
Cengage Learning

Algebra and Trigonometry (MindTap Course List)
Algebra
ISBN:
9781305071742
Author:
James Stewart, Lothar Redlin, Saleem Watson
Publisher:
Cengage Learning
Elementary Linear Algebra (MindTap Course List)
Algebra
ISBN:
9781305658004
Author:
Ron Larson
Publisher:
Cengage Learning
Algebra and Trigonometry (MindTap Course List)
Algebra
ISBN:
9781305071742
Author:
James Stewart, Lothar Redlin, Saleem Watson
Publisher:
Cengage Learning

College Algebra
Algebra
ISBN:
9781305115545
Author:
James Stewart, Lothar Redlin, Saleem Watson
Publisher:
Cengage Learning

College Algebra (MindTap Course List)
Algebra
ISBN:
9781305652231
Author:
R. David Gustafson, Jeff Hughes
Publisher:
Cengage Learning

Algebra & Trigonometry with Analytic Geometry
Algebra
ISBN:
9781133382119
Author:
Swokowski
Publisher:
Cengage