Paper factories emit chemicals as a waste product. This generates a cost to society that is not paid for by the firm; therefore, pollution is a negative externality of paper production. Suppose the U.S. government wants to correct this market failure by getting firms to internalize the cost of pollution. To do this, the government can charge firms for pollution rights (the right to emit a given quantity of chemicals). The following graph shows the daily demand for pollution rights. Use the graph input tool to help you answer the following questions. You will not be graded on any changes you make to this graph. Note: Once you enter a value in a white field, the graph and any corresponding amounts in each grey field will change accordingly. Suppose the government has determined that the socially optimal quantity of chemical pollution is 120 million tons per day. One way governments can charge firms for pollution rights is by imposing a per-unit tax on emissions. A tax (or price in this case) of per ton of chemicals emitted will achieve the desired level of pollution.
Paper factories emit chemicals as a waste product. This generates a cost to society that is not paid for by the firm; therefore, pollution is a negative externality of paper production. Suppose the U.S. government wants to correct this market failure by getting firms to internalize the cost of pollution. To do this, the government can charge firms for pollution rights (the right to emit a given quantity of chemicals). The following graph shows the daily demand for pollution rights. Use the graph input tool to help you answer the following questions. You will not be graded on any changes you make to this graph. Note: Once you enter a value in a white field, the graph and any corresponding amounts in each grey field will change accordingly. Suppose the government has determined that the socially optimal quantity of chemical pollution is 120 million tons per day. One way governments can charge firms for pollution rights is by imposing a per-unit tax on emissions. A tax (or price in this case) of per ton of chemicals emitted will achieve the desired level of pollution.

Chapter12: Balanced Scorecard And Other Performance Measures
Section: Chapter Questions
Problem 11MC: Dixon Construction Materials has collected this information: Based on this Information, what is the...

Related questions
Question
Paper factories emit chemicals as a waste product. This generates a cost to society that is not paid for by the firm; therefore, pollution is a negative externality of paper production. Suppose the U.S. government wants to correct this market failure by getting firms to internalize the cost of pollution. To do this, the government can charge firms for pollution rights (the right to emit a given quantity of chemicals). The following graph shows the daily demand for pollution rights.
Use the graph input tool to help you answer the following questions. You will not be graded on any changes you make to this graph.
Note: Once you enter a value in a white field, the graph and any corresponding amounts in each grey field will change accordingly.
Suppose the government has determined that the socially optimal quantity of chemical pollution is 120 million tons per day.
One way governments can charge firms for pollution rights is by imposing a per-unit tax on emissions. A tax (or price in this case) of
per ton of chemicals emitted will achieve the desired level of pollution.
Now suppose the U.S. government does not know the demand curve for pollution and, therefore, cannot determine the optimal tax to achieve the desired level of pollution. Instead, it auctions off tradable pollution permits. Each permit entitles its owner to emit one ton of chemicals per day. To achieve the socially optimal quantity of pollution, the government auctions off 120 million pollution permits. Given this quantity of permits, the price for each permit in the market for pollution rights will be
.
The previous analysis hinges on the government having good information regarding either the demand for pollution permits or the optimal level of pollution (or both). Given that the appropriate policy (tradable permits or corrective taxes) can depend on the available information and the policy goal, consider the following scenario.
Imagine that new research suggests that if manufacturers in a particular city reduced their emissions to 10 million tons of waste per year, the air quality would improve dramatically.
If this is all the information the government has, which solution to reduce pollution is appropriate? Check all that apply.
Corrective taxes
Tradable permits
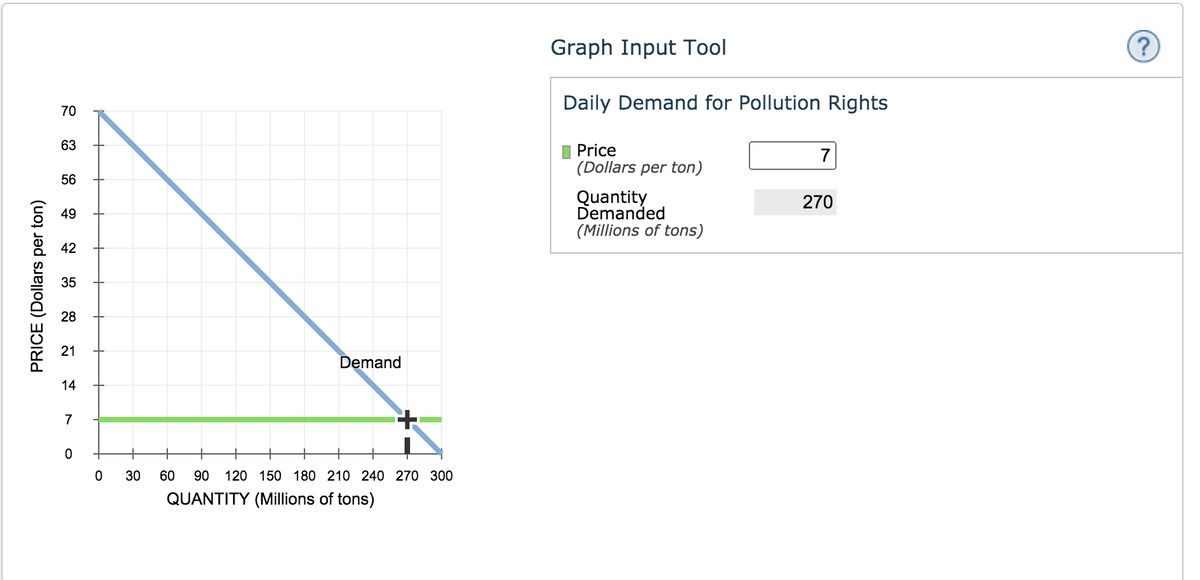
Transcribed Image Text:Graph Input Tool
Daily Demand for Pollution Rights
70
63
I Price
(Dollars per ton)
7
56
Quantity
Demanded
(Millions of tons)
270
49
42
35
28
21
Demand
14
7
+
30
60
90 120 150 180 210 240 270 300
QUANTITY (Millions of tons)
PRICE (Dollars per ton)
Expert Solution
This question has been solved!
Explore an expertly crafted, step-by-step solution for a thorough understanding of key concepts.

This is a popular solution!

Trending now
This is a popular solution!

Step by step
Solved in 2 steps with 2 images

Knowledge Booster


Learn more about
Need a deep-dive on the concept behind this application? Look no further. Learn more about this topic, accounting and related others by exploring similar questions and additional content below.Recommended textbooks for you
Principles of Accounting Volume 2
Accounting
ISBN:
9781947172609
Author:
OpenStax
Publisher:
OpenStax College


Cornerstones of Cost Management (Cornerstones Ser…
Accounting
ISBN:
9781305970663
Author:
Don R. Hansen, Maryanne M. Mowen
Publisher:
Cengage Learning
Principles of Accounting Volume 2
Accounting
ISBN:
9781947172609
Author:
OpenStax
Publisher:
OpenStax College
Cornerstones of Cost Management (Cornerstones Ser…
Accounting
ISBN:
9781305970663
Author:
Don R. Hansen, Maryanne M. Mowen
Publisher:
Cengage Learning

Pkg Acc Infor Systems MS VISIO CD
Finance
ISBN:
9781133935940
Author:
Ulric J. Gelinas
Publisher:
CENGAGE L