Part 1: Correlation and Linear Regression It is widely believed that the more education one receives the higher the income earned over the course of a career. However, du to varying reasons, many people never complete their high-school diploma or GED. Although individuals without a high-school diploma are often able to find employment, they experience economic outcomes quite different from those who finish high schoo before entering the workforce. 1. Use technology to create and provide a scatterplot of the relationship between the "percent of people in poverty" and th "percent of population 25 years and over with no high school diploma" data for each jurisdiction. Write at least two (2) sentences explaining how/why it is appropriate to create such a scatterplot and describe the characteristics of the association seen in the scatterplot. 2. Be sure to use the actual names of the variables in their appropriate places in your response(s). (Print or copy-and-paste the scatterplot and be sure to clearly identify the predictor and response variables based on the possible believed association.) Use technology to find the regression equation for the linear association between the "percent of people in poverty" and the "percent of population 25 years and over with no high school diploma." (Round final values to two decimal places.) Provide this equation. 2 Babe Write a brief interpretation (1-2 sentences) of the slope using the variable names. Gand (Print or copy-and-paste the printout that identified the equation of the linear regression line, or any other form of evidence that technology was used.) 3. A fellow student states that a decrease in the "percent of population 25 years and over with no high school diploma" wil lead to a decrease in the "percent of people in poverty." Write at least two (2) concise sentences in a response to the student's statement, being sure to address the key uses of linear correlation and comment on its limitations.
Part 1: Correlation and Linear Regression It is widely believed that the more education one receives the higher the income earned over the course of a career. However, du to varying reasons, many people never complete their high-school diploma or GED. Although individuals without a high-school diploma are often able to find employment, they experience economic outcomes quite different from those who finish high schoo before entering the workforce. 1. Use technology to create and provide a scatterplot of the relationship between the "percent of people in poverty" and th "percent of population 25 years and over with no high school diploma" data for each jurisdiction. Write at least two (2) sentences explaining how/why it is appropriate to create such a scatterplot and describe the characteristics of the association seen in the scatterplot. 2. Be sure to use the actual names of the variables in their appropriate places in your response(s). (Print or copy-and-paste the scatterplot and be sure to clearly identify the predictor and response variables based on the possible believed association.) Use technology to find the regression equation for the linear association between the "percent of people in poverty" and the "percent of population 25 years and over with no high school diploma." (Round final values to two decimal places.) Provide this equation. 2 Babe Write a brief interpretation (1-2 sentences) of the slope using the variable names. Gand (Print or copy-and-paste the printout that identified the equation of the linear regression line, or any other form of evidence that technology was used.) 3. A fellow student states that a decrease in the "percent of population 25 years and over with no high school diploma" wil lead to a decrease in the "percent of people in poverty." Write at least two (2) concise sentences in a response to the student's statement, being sure to address the key uses of linear correlation and comment on its limitations.

Algebra and Trigonometry (MindTap Course List)
4th Edition
ISBN:9781305071742
Author:James Stewart, Lothar Redlin, Saleem Watson
Publisher:James Stewart, Lothar Redlin, Saleem Watson
Chapter14: Counting And Probability
Section14.1: Counting
Problem 84E

Related questions
Question
Transcribed Image Text:Jurisdiction
Alabama
Alaska
Arizona
Arkansas
California
Colorado
Connecticut
Delaware
District of Columbia
Florida
Georgia
Hawaii
Idaho
Illinois
Indiana
lowa
Kansas
Kentucky
Louisiana
Maine
Maryland
Massachusetts
Michigan
Minnesota
Mississippi
Missouri
Montana
Nebraska
Nevada
New Hampshire
New Jersey
New Mexico
New York
North Carolina
North Dakota
Ohio
Oklahoma
Oregon
Pennsylvania
Rhode Island
South Carolina
South Dakota
Tennessee
Texas
Utah
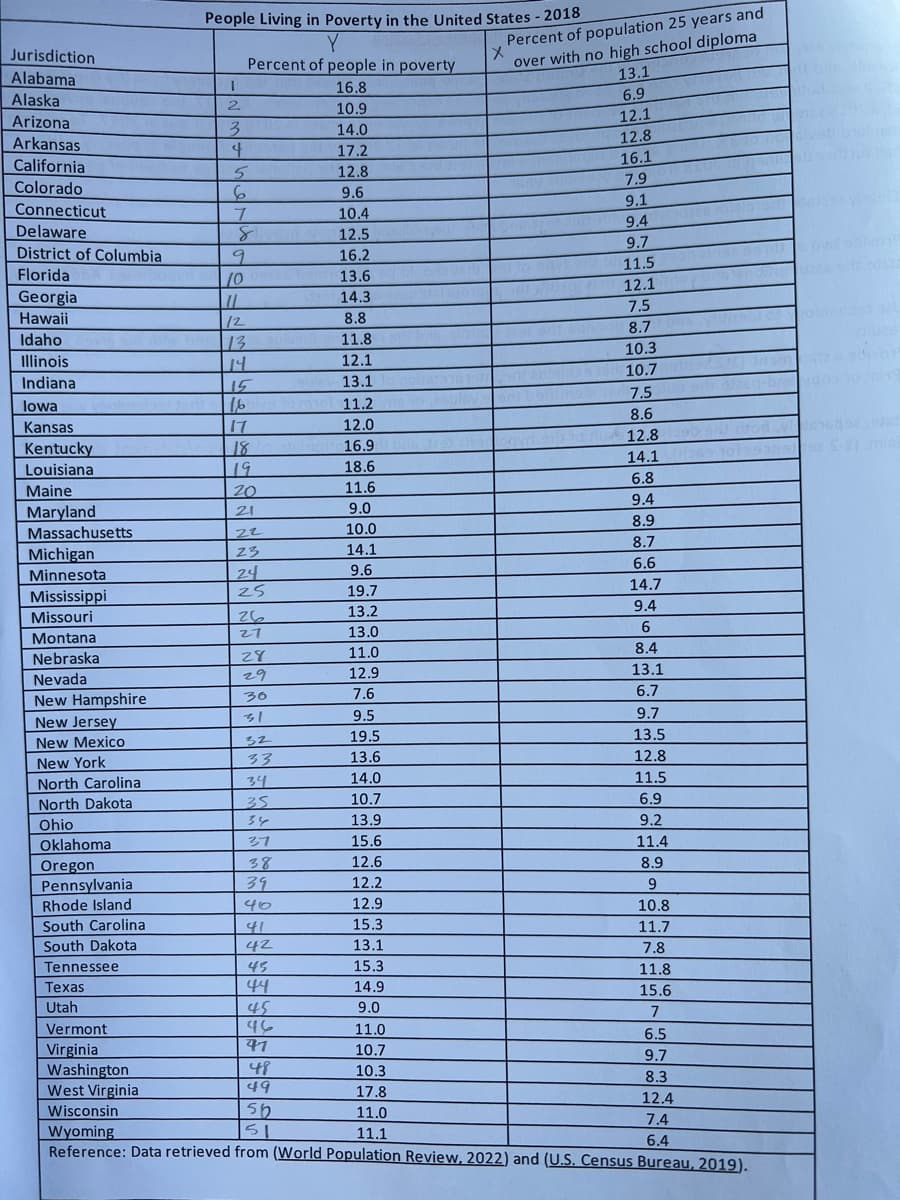
People Living in Poverty in the United States - 2018
Y
Percent of people in poverty
x
Percent of population 25 years and
over with no high school diploma
16.8
13.1
6.9
12.1
Vermont
Virginia
Washington
I
2
3
4
5
6
7
8
9
10
11
12
13
14
15
16
17
18
19
20
21
22
23
24
25
26
27
28
29
30
31
32
33
34
35
34
37
38
39
40
41
42
45
44
45
مای
47
48
49
10.9
14.0
56
51
17.2
12.8
9.6
10.4
12.5
16.2
13.6
14.3
8.8
11.8
12.1
13.1
11.2
12.0
16.9
18.6
11.6
9.0
10.0
14.1
9.6
19.7
13.2
13.0
11.0
12.9
7.6
9.5
19.5
13.6
14.0
10.7
13.9
15.6
12.6
12.2
12.9
15.3
13.1
15.3
14.9
9.0
11.0
10.7
10.3
17.8
11.0
11.1
bris Ize
11.7
7.8
11.8
15.6
7
6.5
9.7
8.3
West Virginia
12.4
Wisconsin
7.4
Wyoming
6.4
Reference: Data retrieved from (World Population Review, 2022) and (U.S. Census Bureau, 2019).
12.8
16.1
7.9
9.1
9.4
9.7
11.5
12.1
7.5
8.7
10.3
10.7
7.5
8.6
12.8
14.1
6.8
9.4
8.9
8.7
6.6
14.7
9.4
6
8.4
13.1
6.7
9.7
13.5
12.8
11.5
6.9
9.2
11.4
8.9
9
10.8
8q-br
and drod
ygos 10 nig
Transcribed Image Text:Part 1: Correlation and Linear Regression
It is widely believed that the more education one receives the higher the income earned over the course of a career. However, due
to varying reasons, many people never complete their high-school diploma or GED. Although individuals without a high-school
diploma are often able to find employment, they experience economic outcomes quite different from those who finish high school
before entering the workforce.
1.
2.
Use technology to create and provide a scatterplot of the relationship between the "percent of people in poverty" and the
"percent of population 25 years and over with no high school diploma" data for each jurisdiction.
Write at least two (2) sentences explaining how/why it is appropriate to create such a scatterplot and describe the
characteristics of the association seen in the scatterplot.
Be sure to use the actual names of the variables in their appropriate places in your response(s).
(Print or copy-and-paste the scatterplot and be sure to clearly identify the predictor and response variables based on the
possible believed association.)
Use technology to find the regression equation for the linear association between the "percent of people in poverty" and
the "percent of population 25 years and over with no high school diploma." (Round final values to two decimal places.)
Provide this equation.
Be Write a brief interpretation (1-2 sentences) of the slope using the variable names. Gand
(Print or copy-and-paste the printout that identified the equation of the linear regression line, or any other form of
evidence that technology was used.)
3.
A fellow student states that a decrease in the "percent of population 25 years and over with no high school diploma" will
lead to a decrease in the "percent of people in poverty."
Write at least two (2) concise sentences in a response to the student's statement, being sure to address the key uses of
linear correlation and comment on its limitations.
Expert Solution
This question has been solved!
Explore an expertly crafted, step-by-step solution for a thorough understanding of key concepts.

This is a popular solution!

Trending now
This is a popular solution!

Step by step
Solved in 5 steps with 4 images

Recommended textbooks for you
Algebra and Trigonometry (MindTap Course List)
Algebra
ISBN:
9781305071742
Author:
James Stewart, Lothar Redlin, Saleem Watson
Publisher:
Cengage Learning

Algebra & Trigonometry with Analytic Geometry
Algebra
ISBN:
9781133382119
Author:
Swokowski
Publisher:
Cengage
Algebra and Trigonometry (MindTap Course List)
Algebra
ISBN:
9781305071742
Author:
James Stewart, Lothar Redlin, Saleem Watson
Publisher:
Cengage Learning
Algebra & Trigonometry with Analytic Geometry
Algebra
ISBN:
9781133382119
Author:
Swokowski
Publisher:
Cengage