Part: 1/3 Part 2 of 3 Find the variance. Round your answer to one decimal place as needed. Variance: o X Ś
Part: 1/3 Part 2 of 3 Find the variance. Round your answer to one decimal place as needed. Variance: o X Ś

College Algebra
7th Edition
ISBN:9781305115545
Author:James Stewart, Lothar Redlin, Saleem Watson
Publisher:James Stewart, Lothar Redlin, Saleem Watson
Chapter9: Counting And Probability
Section9.3: Binomial Probability
Problem 2E: If a binomial experiment has probability p success, then the probability of failure is...

Related questions
Question
100%
Please help this is class work
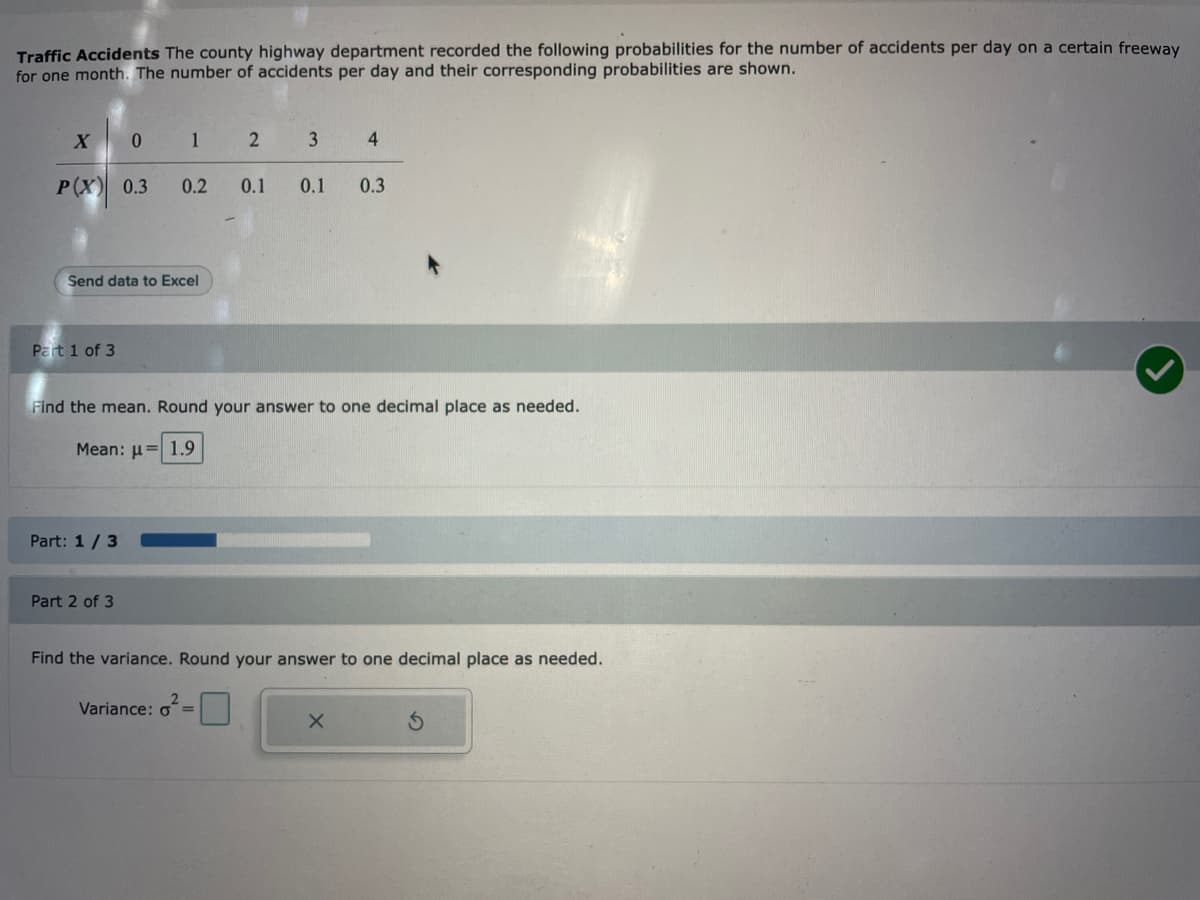
Transcribed Image Text:Traffic Accidents The county highway department recorded the following probabilities for the number of accidents per day on a certain freeway
for one month. The number of accidents per day and their corresponding probabilities are shown.
X
P(X) 0.3
Part 1 of 3
0
Send data to Excel
Part: 1/3
1
Part 2 of 3
0.2
2
3
Variance: o=
0.1 0.1
Find the mean. Round your answer to one decimal place as needed.
Mean: μ= 1.9
4
0.3
Find the variance. Round your answer to one decimal place as needed.
X
Expert Solution
This question has been solved!
Explore an expertly crafted, step-by-step solution for a thorough understanding of key concepts.

Step by step
Solved in 4 steps

Recommended textbooks for you
College Algebra
Algebra
ISBN:
9781305115545
Author:
James Stewart, Lothar Redlin, Saleem Watson
Publisher:
Cengage Learning
College Algebra
Algebra
ISBN:
9781305115545
Author:
James Stewart, Lothar Redlin, Saleem Watson
Publisher:
Cengage Learning