Part 3- Graphing draw a best-fit line through the points, and calculate the slope. Be sure to label your graph completely and correctly. SHOW ALL WORK FOR YOUR SLOPE : Plot voltage versus current for the following data. Then, What is the name of the quantity that the slope of this graph represents? Voltage Show your work below for the slope. current Unit :V unit: mA 2.9 1.1 8.8 3.4 25 4.8 34 6.5 40 7.5 47 Slope= 9.2 58 11.3 61
Part 3- Graphing draw a best-fit line through the points, and calculate the slope. Be sure to label your graph completely and correctly. SHOW ALL WORK FOR YOUR SLOPE : Plot voltage versus current for the following data. Then, What is the name of the quantity that the slope of this graph represents? Voltage Show your work below for the slope. current Unit :V unit: mA 2.9 1.1 8.8 3.4 25 4.8 34 6.5 40 7.5 47 Slope= 9.2 58 11.3 61

Power System Analysis and Design (MindTap Course List)
6th Edition
ISBN:9781305632134
Author:J. Duncan Glover, Thomas Overbye, Mulukutla S. Sarma
Publisher:J. Duncan Glover, Thomas Overbye, Mulukutla S. Sarma
Chapter2: Fundamentals
Section: Chapter Questions
Problem 2.39P

Related questions
Question
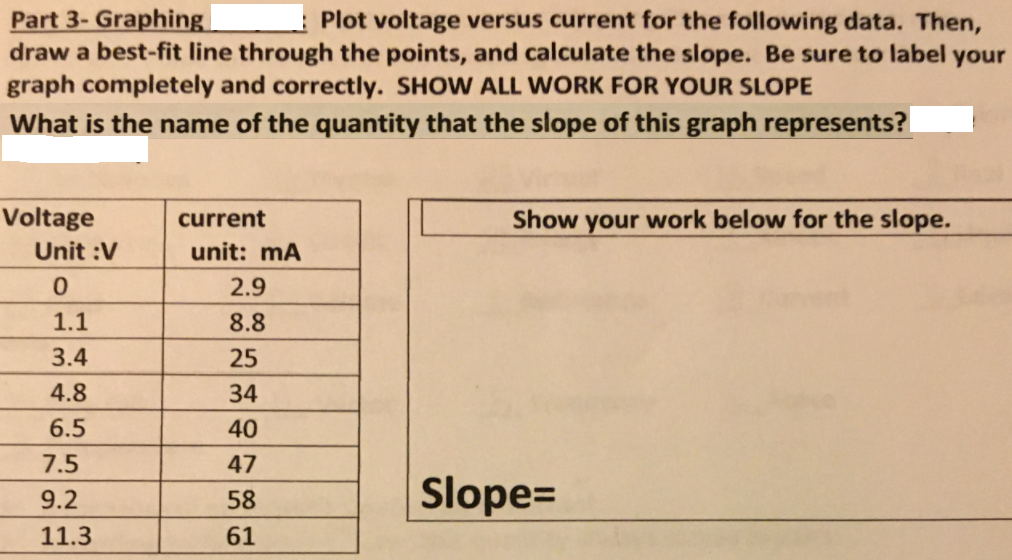
Transcribed Image Text:Part 3- Graphing
draw a best-fit line through the points, and calculate the slope. Be sure to label your
graph completely and correctly. SHOW ALL WORK FOR YOUR SLOPE
: Plot voltage versus current for the following data. Then,
What is the name of the quantity that the slope of this graph represents?
Voltage
Show your work below for the slope.
current
Unit :V
unit: mA
2.9
1.1
8.8
3.4
25
4.8
34
6.5
40
7.5
47
Slope=
9.2
58
11.3
61
Expert Solution
This question has been solved!
Explore an expertly crafted, step-by-step solution for a thorough understanding of key concepts.

Step by step
Solved in 3 steps with 4 images

Knowledge Booster


Learn more about
Need a deep-dive on the concept behind this application? Look no further. Learn more about this topic, electrical-engineering and related others by exploring similar questions and additional content below.Recommended textbooks for you
Power System Analysis and Design (MindTap Course …
Electrical Engineering
ISBN:
9781305632134
Author:
J. Duncan Glover, Thomas Overbye, Mulukutla S. Sarma
Publisher:
Cengage Learning
Power System Analysis and Design (MindTap Course …
Electrical Engineering
ISBN:
9781305632134
Author:
J. Duncan Glover, Thomas Overbye, Mulukutla S. Sarma
Publisher:
Cengage Learning