Part 7 of 9 (f) Test the hypothesis that the grades follow the distribution claimed by the teacher. Use the 0.05 level of signifi Find the critical value. Round answers to at least three decimal places. Critical value is
Part 7 of 9 (f) Test the hypothesis that the grades follow the distribution claimed by the teacher. Use the 0.05 level of signifi Find the critical value. Round answers to at least three decimal places. Critical value is

Algebra & Trigonometry with Analytic Geometry
13th Edition
ISBN:9781133382119
Author:Swokowski
Publisher:Swokowski
Chapter10: Sequences, Series, And Probability
Section: Chapter Questions
Problem 9DE

Related questions
Question
Part 7 please
Transcribed Image Text:Part: 6/9
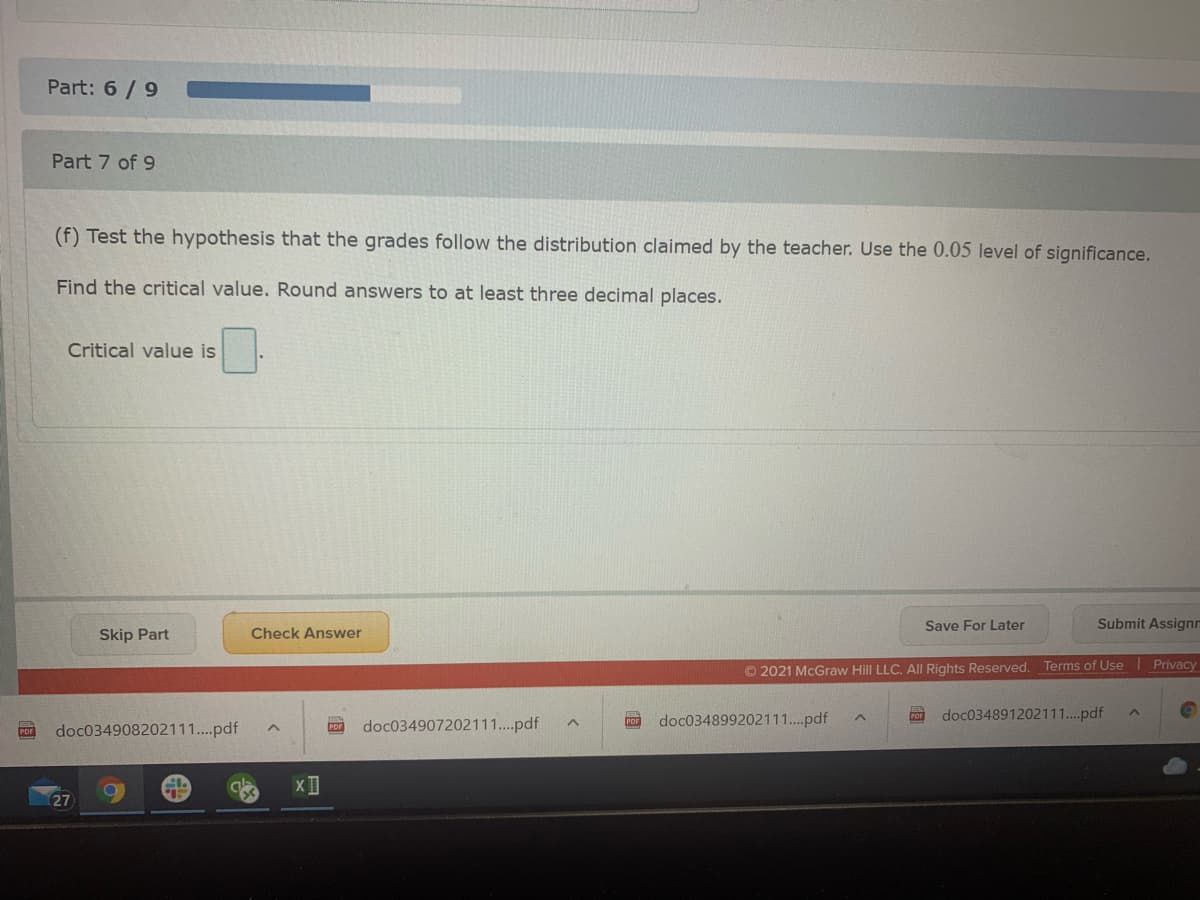
Part 7 of 9
(f) Test the hypothesis that the grades follow the distribution claimed by the teacher. Use the 0.05 level of significance.
Find the critical value. Round answers to at least three decimal places.
Critical value is
Save For Later
Submit Assignn
Skip Part
Check Answer
© 2021 McGraw Hill LLC. AlIl Rights Reserved. Terms of Use Privacy
doc034899202111..pdf
doc034891202111.pdf
doc034908202111..pdf
doc034907202111..pdf
PDF
27
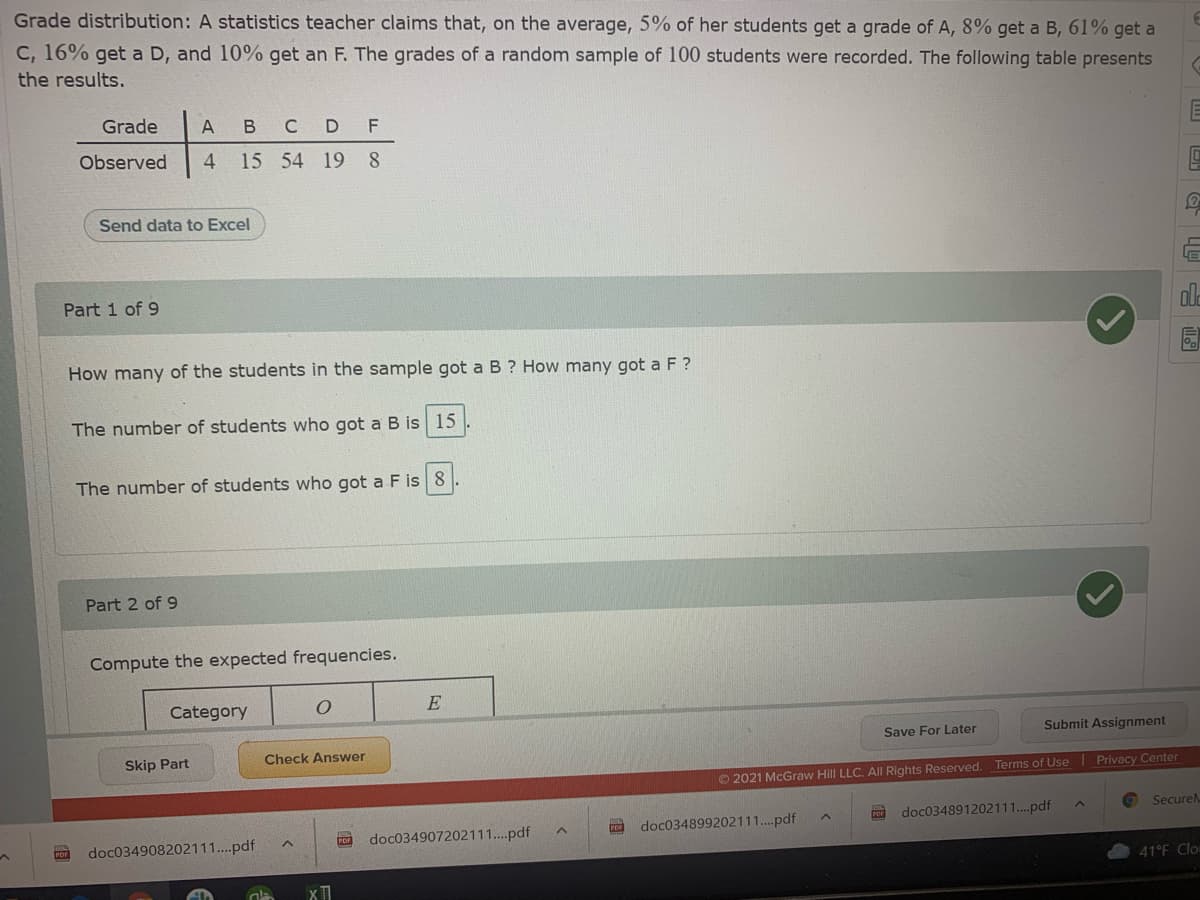
Transcribed Image Text:Grade distribution: A statistics teacher claims that, on the average, 5% of her students get a grade of A, 8% get a B, 61% get a
C, 16% get a D, and 10% get an F. The grades of a random sample of 100 students were recorded. The following table presents
the results.
Grade
B CD F
Observed
4
15 54 19 8
Send data to Excel
Part 1 of 9
ola
國
How many of the students in the sample got a B ? How many got a F ?
The number of students who got a B is 15
The number of students who got a F is 8
Part 2 of 9
Compute the expected frequencies.
Category
E
Save For Later
Submit Assignment
Skip Part
Check Answer
©2021 McGraw Hill LLC. All Rights Reserved. Terms of Use Privacy Center
Securen
doc034891202111..pdf
doc034907202111..pdf
doc034899202111.pdf
doc034908202111..pdf
41°F Clo
Expert Solution
This question has been solved!
Explore an expertly crafted, step-by-step solution for a thorough understanding of key concepts.

Step by step
Solved in 2 steps

Recommended textbooks for you
Algebra & Trigonometry with Analytic Geometry
Algebra
ISBN:
9781133382119
Author:
Swokowski
Publisher:
Cengage
Algebra & Trigonometry with Analytic Geometry
Algebra
ISBN:
9781133382119
Author:
Swokowski
Publisher:
Cengage