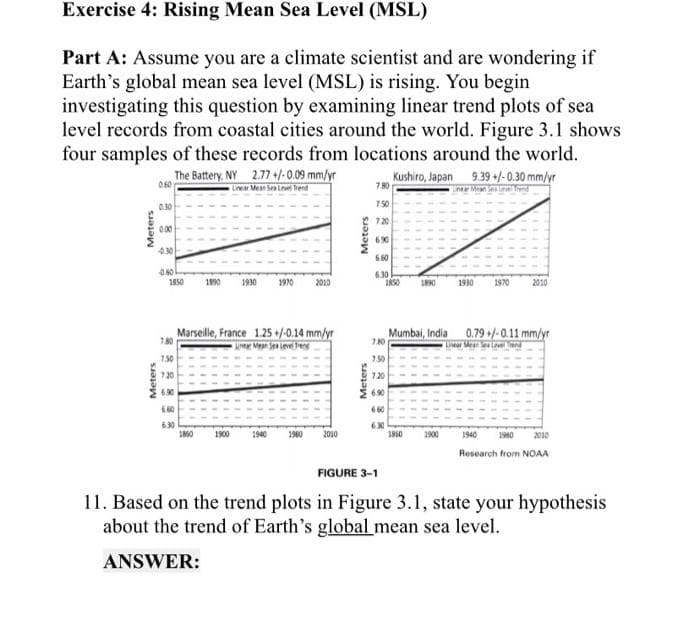
Part A: Assume you are a climate scientist and are wondering if Earth's global mean sea level (MSL) is rising. You begin investigating this question by examining linear trend plots of sea level records from coastal cities around the world. Figure 3.1 shows four samples of these records from locations around the world. The Battery, NY 2.77 +/-0.09 mm/yr eMean rerd Kushiro, Japan 9.39 /-0.30 mm/yr 7.80 750 0.10 720 000 690 4.30 610 2010 630 180 1970 2010 1850 190 Marselle, France 1.25+/-0.14 mm/yr AM Me e iee Mumbai, India 0.79 +/-0.11 mm/yr Lie Meale 7.30 130 720 630 690 640 430 IMO 1940 1900 100 1940 190 1900 2010 2010 Rosearch from NOAA FIGURE 3-1 11. Based on the trend plots in Figure 3.1, state your hypothesis about the trend of Earth's global mean sea level. Meters Meters Meters Meters
Part A: Assume you are a climate scientist and are wondering if Earth's global mean sea level (MSL) is rising. You begin investigating this question by examining linear trend plots of sea level records from coastal cities around the world. Figure 3.1 shows four samples of these records from locations around the world. The Battery, NY 2.77 +/-0.09 mm/yr eMean rerd Kushiro, Japan 9.39 /-0.30 mm/yr 7.80 750 0.10 720 000 690 4.30 610 2010 630 180 1970 2010 1850 190 Marselle, France 1.25+/-0.14 mm/yr AM Me e iee Mumbai, India 0.79 +/-0.11 mm/yr Lie Meale 7.30 130 720 630 690 640 430 IMO 1940 1900 100 1940 190 1900 2010 2010 Rosearch from NOAA FIGURE 3-1 11. Based on the trend plots in Figure 3.1, state your hypothesis about the trend of Earth's global mean sea level. Meters Meters Meters Meters

Chapter6: Exponential And Logarithmic Functions
Section6.8: Fitting Exponential Models To Data
Problem 3TI: Table 6 shows the population, in thousands, of harbor seals in the Wadden Sea over the years 1997 to...

Related questions
Question
5
Transcribed Image Text:Exercise 4: Rising Mean Sea Level (MSL)
Part A: Assume you are a climate scientist and are wondering if
Earth's global mean sea level (MSL) is rising. You begin
investigating this question by examining linear trend plots of sea
level records from coastal cities around the world. Figure 3.1 shows
four samples of these records from locations around the world.
The Battery, NY 2.77 +/- 0.09 mm/yr
Lnear Mesn Sea Level Trend
Kushiro, Japan 9.39 +/-0.30 mm/yr
060
7.80
UnMean
7.50
720
00
6.90
6.60
1850
630
1850
1890
1930
1970
1890
1930
1970
Marseille, France 1.25+-0.14 mm/yr
Mumbai, India 0.79+-0.11 mm/yr
LI Mean lveA
780
150
7.50
120
720
690
6.90
640
630
1940
630
1860
1900
1960
2010
1900
1940
1980 2010
Research from NOAA
FIGURE 3-1
11. Based on the trend plots in Figure 3.1, state your hypothesis
about the trend of Earth's global mean sea level.
ANSWER:
Meters
Meters
Meters
Meters
Expert Solution
This question has been solved!
Explore an expertly crafted, step-by-step solution for a thorough understanding of key concepts.

This is a popular solution!

Trending now
This is a popular solution!

Step by step
Solved in 2 steps

Recommended textbooks for you

Glencoe Algebra 1, Student Edition, 9780079039897…
Algebra
ISBN:
9780079039897
Author:
Carter
Publisher:
McGraw Hill

Algebra and Trigonometry (MindTap Course List)
Algebra
ISBN:
9781305071742
Author:
James Stewart, Lothar Redlin, Saleem Watson
Publisher:
Cengage Learning
Glencoe Algebra 1, Student Edition, 9780079039897…
Algebra
ISBN:
9780079039897
Author:
Carter
Publisher:
McGraw Hill
Algebra and Trigonometry (MindTap Course List)
Algebra
ISBN:
9781305071742
Author:
James Stewart, Lothar Redlin, Saleem Watson
Publisher:
Cengage Learning

Big Ideas Math A Bridge To Success Algebra 1: Stu…
Algebra
ISBN:
9781680331141
Author:
HOUGHTON MIFFLIN HARCOURT
Publisher:
Houghton Mifflin Harcourt