Part A The following data show the weekly food expenditure (in RM) of 30 university students. 88 80 72 61 50 43 30 21 42 32 61 72 87 99 88 77 66 54 45 54 67 75 98 76 67 69 68 69 76 78 i. Based on the data given, construct frequency distribution using the following class intervals: 20 and under 30, 30 and under 40, etc. ii. Find the mean and standard deviation based on frequency distribution in (i).
Part A The following data show the weekly food expenditure (in RM) of 30 university students. 88 80 72 61 50 43 30 21 42 32 61 72 87 99 88 77 66 54 45 54 67 75 98 76 67 69 68 69 76 78 i. Based on the data given, construct frequency distribution using the following class intervals: 20 and under 30, 30 and under 40, etc. ii. Find the mean and standard deviation based on frequency distribution in (i).

Glencoe Algebra 1, Student Edition, 9780079039897, 0079039898, 2018
18th Edition
ISBN:9780079039897
Author:Carter
Publisher:Carter
Chapter10: Statistics
Section10.6: Summarizing Categorical Data
Problem 4BGP

Related questions
Question
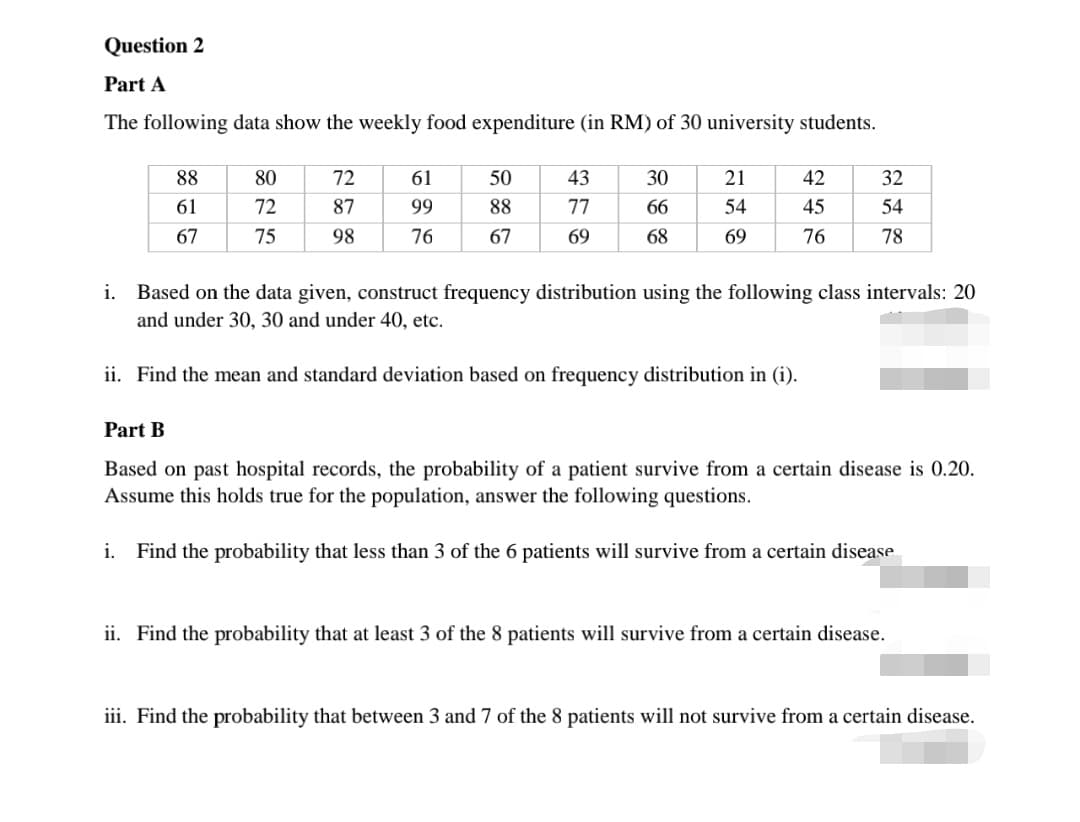
Transcribed Image Text:Question 2
Part A
The following data show the weekly food expenditure (in RM) of 30 university students.
88
80
72
61
50
43
30
21
42
32
61
72
87
99
88
77
66
54
45
54
67
75
98
76
67
69
68
69
76
78
i. Based on the data given, construct frequency distribution using the following class intervals: 20
and under 30, 30 and under 40, etc.
ii. Find the mean and standard deviation based on frequency distribution in (i).
Part B
Based on past hospital records, the probability of a patient survive from a certain disease is 0.20.
Assume this holds true for the population, answer the following questions.
i. Find the probability that less than 3 of the 6 patients will survive from a certain disease
ii. Find the probability that at least 3 of the 8 patients will survive from a certain disease.
iii. Find the probability that between 3 and 7 of the 8 patients will not survive from a certain disease.
Expert Solution
This question has been solved!
Explore an expertly crafted, step-by-step solution for a thorough understanding of key concepts.

Step by step
Solved in 3 steps with 2 images

Recommended textbooks for you
Glencoe Algebra 1, Student Edition, 9780079039897…
Algebra
ISBN:
9780079039897
Author:
Carter
Publisher:
McGraw Hill
Glencoe Algebra 1, Student Edition, 9780079039897…
Algebra
ISBN:
9780079039897
Author:
Carter
Publisher:
McGraw Hill