PART B: a) One of the submissions for the roller coaster proposal contains the following information: . " The function representing the roller coaster is y=-x² + 2x³ + 13x² - 14x - 24. Two of the x-intercepts are at x = -3 and x = 4. Determine the other x-intercept(s) Determine the first derivative of the function There are three extrema at x -2.193 x 0.5, and x 3.193. Determine the y-values at the extrema. (round the answer to the nearest hundredth) Determine the first derivative of the function There are two possible point of inflection at x =-1.055 and x = 2.055. Determine the y-values at the points of inflection. (round the answer to the nearest hundredth) Use a chart, to complete the first and second derivative tests in the chart below to get a better idea of what the roller coaster would look like. The sign of the FIRST derivative The behaviour of the function The sign of the SECOND derivative The behaviour of the function The SHAPE of the graph b) Draw a sketch of the roller coaster on a graph (from the previous chart). Be sure to graph all necessary points, label your Critical Points (CPs) and Points of Inflections (POIs) and indicate them on the graph. Choose an appropriate scale for graph.
PART B: a) One of the submissions for the roller coaster proposal contains the following information: . " The function representing the roller coaster is y=-x² + 2x³ + 13x² - 14x - 24. Two of the x-intercepts are at x = -3 and x = 4. Determine the other x-intercept(s) Determine the first derivative of the function There are three extrema at x -2.193 x 0.5, and x 3.193. Determine the y-values at the extrema. (round the answer to the nearest hundredth) Determine the first derivative of the function There are two possible point of inflection at x =-1.055 and x = 2.055. Determine the y-values at the points of inflection. (round the answer to the nearest hundredth) Use a chart, to complete the first and second derivative tests in the chart below to get a better idea of what the roller coaster would look like. The sign of the FIRST derivative The behaviour of the function The sign of the SECOND derivative The behaviour of the function The SHAPE of the graph b) Draw a sketch of the roller coaster on a graph (from the previous chart). Be sure to graph all necessary points, label your Critical Points (CPs) and Points of Inflections (POIs) and indicate them on the graph. Choose an appropriate scale for graph.

Algebra & Trigonometry with Analytic Geometry
13th Edition
ISBN:9781133382119
Author:Swokowski
Publisher:Swokowski
Chapter7: Analytic Trigonometry
Section7.6: The Inverse Trigonometric Functions
Problem 94E

Related questions
Question
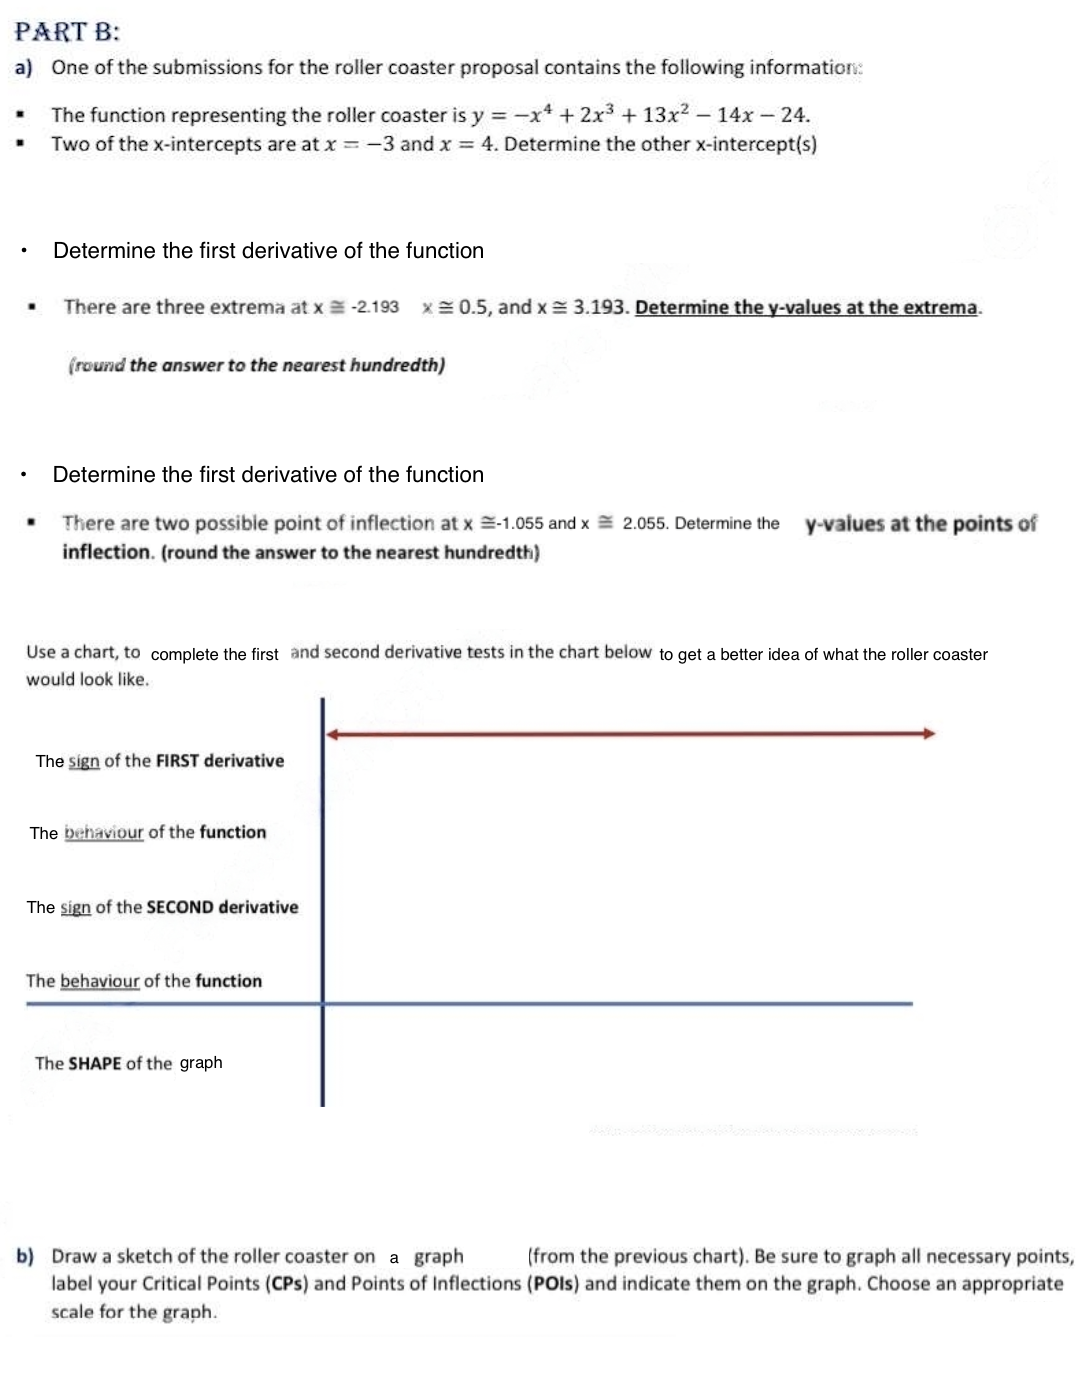
Transcribed Image Text:PART B:
a) One of the submissions for the roller coaster proposal contains the following information:
.
"
.
.
The function representing the roller coaster is y = -x + 2x³ + 13x² - 14x - 24.
Two of the x-intercepts are at x = -3 and x = 4. Determine the other x-intercept(s)
Determine the first derivative of the function
There are three extrema at x = -2.193 x = 0.5, and x = 3.193. Determine the y-values at the extrema.
(round the answer to the nearest hundredth)
Determine the first derivative of the function
There are two possible point of inflection at x =-1.055 and x = 2.055. Determine the y-values at the points of
inflection. (round the answer to the nearest hundredth)
Use a chart, to complete the first and second derivative tests in the chart below to get a better idea of what the roller coaster
would look like.
The sign of the FIRST derivative
The behaviour of the function
The sign of the SECOND derivative
The behaviour of the function
The SHAPE of the graph
b) Draw a sketch of the roller coaster on a graph
(from the previous chart). Be sure to graph all necessary points,
label your Critical Points (CPs) and Points of Inflections (POIs) and indicate them on the graph. Choose an appropriate
scale for the graph.
Expert Solution
This question has been solved!
Explore an expertly crafted, step-by-step solution for a thorough understanding of key concepts.

Step by step
Solved in 5 steps with 11 images

Recommended textbooks for you
Algebra & Trigonometry with Analytic Geometry
Algebra
ISBN:
9781133382119
Author:
Swokowski
Publisher:
Cengage

Algebra and Trigonometry (MindTap Course List)
Algebra
ISBN:
9781305071742
Author:
James Stewart, Lothar Redlin, Saleem Watson
Publisher:
Cengage Learning
Algebra & Trigonometry with Analytic Geometry
Algebra
ISBN:
9781133382119
Author:
Swokowski
Publisher:
Cengage
Algebra and Trigonometry (MindTap Course List)
Algebra
ISBN:
9781305071742
Author:
James Stewart, Lothar Redlin, Saleem Watson
Publisher:
Cengage Learning