
Advanced Engineering Mathematics
10th Edition
ISBN: 9780470458365
Author: Erwin Kreyszig
Publisher: Wiley, John & Sons, Incorporated
expand_more
expand_more
format_list_bulleted
Related questions
Question
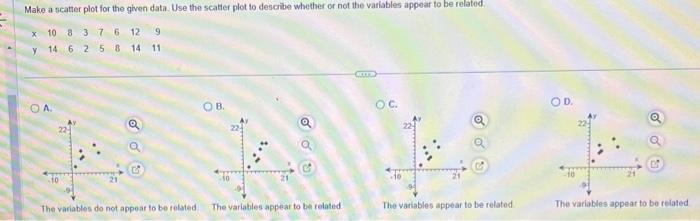

Transcribed Image Text:Make a scatter plot for the given data. Use the scatter plot to describe whether or not the variables appear to be related
10
8
3 7 6
12
9
14 6 2 5 8 14 11
X
Y
C
The variables do not appear to be related
OB.
The variables appear to be related
Ta
OC.
The variables appear to be related
OD.
The variables appear to be related
Expert Solution
This question has been solved!
Explore an expertly crafted, step-by-step solution for a thorough understanding of key concepts.

Step by stepSolved in 3 steps with 2 images

Knowledge Booster

Similar questions
- Use the data from the table to create a scatter plot. Age (years) 3 3 2 5 4 5 7 6 8 6 Length (in.) 13 15 10 17 17 19 23 18 21 19 Length vs. Age Lenth is the Y coordinate Age is the X coordinatearrow_forwardThe table to the right shows teenage drug use in different countries. Make a scatter plot for the given data. Use the scatter plot to describe whether or not the variables appear to be related. % Who Have Used Other Illegal Drugs % Who Have Used Other Illegal Marijuana Drugs Marijuana Country Country A y y 22 31 25 15 21 B 18 1 C D 38 7 38 19 7. 52 5 8 J 5 3 2 K 35 24 F 19 Make a scatter plot of the given data. Choose the correct graph below. A. OB. Oc. OD. at 40 40- 40- 40 20- 20- 20 -L ELJEES 20- 0++1 0 20 40 60 Marijuana % O 20 40 60 0 0 20 40 60 0 20 40 60 Marijuana % Marjuane % Marijuana %arrow_forward2 Z The following are histograms for the heights of 100 US women and the heights of 100 European women: 2 Shape: choose your answer...... V Center: choose your answer..... Spread: choose your answer... v Outliers: choose your answer..... W S # 3 $ d How would the histograms change in appearance if each value was converted from centimeters to inches by dividing by 2.54 and then regraphed on the same horizontal and vertical scales used above? e JL C V JL f % 5 Histograms of Us V t TOM 9 158 12 A 6 y 129 b & 7 h O u 152 n * 156 M 14 Histogram of forw 8 j O 122 sis 10 i 9 k * alt P { ?arrow_forward
- The data represents the heights of eruptions by a geyser. Height of eruption (in.) 64 31 50 909 Use the heights to construct a stemplot. Identify the two values that are closest to the middle when the data are sorted in order from lowest to highest. 80 50 40 70 50 69 73 50 57 66 60 60 78 70 45 85 Which plot represents a stemplot of the data? A. В. С. 3 1 4 05 5 00 007 6 00 4 69 700 3 8 3 1 4 000 4 69 3 0 57 4 00 4 5 00 3 8 6 0 05 5 009 6 000 700 6 8 038 700 5 7 8 0 5 8 0 9 |0 9 |0 9 05 Identify the two values that are closest to the middle when the data are sorted in order from lowest to highest. The values closest to the middle are inches and inches. (Type whole numbers. Use ascending order.)arrow_forwardMs. Leeper gives her sixth- and seventh-grade students a geography test to decide who will represent her class in the school geography bee. The line plots below show the results of the test for her sixth-grade class and seventh-grade class, respectively. Sixth Grade Geography Test Scores x x x X X x X X x X X 2 4 8 10 12 14 16 18 20 Test Score Seventh Grade Geography Test Scores X x x x X X X X X X 2 4 10 12 14 16 18 20 Test Score The data for each grade have the same interquartile range (IQR). Which of the following best compares the two test score distributions? The median score of the seventh-grade class is 2 points greater than the median score of the sixth-grade class. This difference is the same as the IQR. The median score of the seventh-grade class is 2 points greater than the median score of the sixth-grade class. This difference is twice as much as the IQR. The median score of the seventh-grade class is 3 points greater than the median score of the sixth-grade class. This…arrow_forwardConstruct a scatter plot using the following data. Interpret which category of correlation the plot has and explain why.arrow_forward
- Please give handwrittenarrow_forwardDraw a stem-and-leaf plot for the data set. (Enter numbers from smallest to largest separated by spaces. Enter NONE for stems with no values.) Data set A: The annual wages of employees at a small accounting firm are given in thousands of dollars. 50 18 25 19 35 15 22 27 60 26 33 26 17 1 2 3 4 5 6arrow_forwardCalculate the y-intercept for the following set of data. y 0 5 TI 2 8 4 12 6 16arrow_forward
- do the following a.) construct a scatter plot. b.) determine the direction of the straight line that the data points seem to follow. c.) determine the strength of correlation between the two variables depicted in each scatter plot. 1. x 1 2 3 4 5 6 7 8 y 15 20 20 25 32 30 35 22arrow_forwardThe data represents the heights of eruptions by a geyser. Height of eruption (in.) 61 39 50 90P Use the heights to construct a stemplot. Identify the two values that are closest to the middle when the data are sorted in order from lowest to highest. 80 50 40 70 50 60 72 57 59 62 69 60 73 70 41 83 Which plot represents a stemplot of the data? A. В. C. 3 9 4 0 1 5 00079 6 001 2 9 7 0 0 2 3 8 0 3 3 9 3 0 1 9 4 0 17 5 00 0 6 0 0 9 4 0 0 1 279 5 00 2 3 6 00 3 70 0 1 9 7 0 0 2 8 0 2 3 8 0 9 0 3 9 9 |0arrow_forwardWhich of the following describes how the scatter plot appears? Select all that apply. S A 3 N O H 2 strong weak 3 negativearrow_forward
arrow_back_ios
SEE MORE QUESTIONS
arrow_forward_ios
Recommended textbooks for you
- Advanced Engineering MathematicsAdvanced MathISBN:9780470458365Author:Erwin KreyszigPublisher:Wiley, John & Sons, Incorporated
 Numerical Methods for EngineersAdvanced MathISBN:9780073397924Author:Steven C. Chapra Dr., Raymond P. CanalePublisher:McGraw-Hill Education
 Introductory Mathematics for Engineering Applicat...Advanced MathISBN:9781118141809Author:Nathan KlingbeilPublisher:WILEY
  Mathematics For Machine TechnologyAdvanced MathISBN:9781337798310Author:Peterson, John.Publisher:Cengage Learning,

Advanced Engineering Mathematics
Advanced Math
ISBN:9780470458365
Author:Erwin Kreyszig
Publisher:Wiley, John & Sons, Incorporated
Numerical Methods for Engineers
Advanced Math
ISBN:9780073397924
Author:Steven C. Chapra Dr., Raymond P. Canale
Publisher:McGraw-Hill Education
Introductory Mathematics for Engineering Applicat...
Advanced Math
ISBN:9781118141809
Author:Nathan Klingbeil
Publisher:WILEY
Mathematics For Machine Technology
Advanced Math
ISBN:9781337798310
Author:Peterson, John.
Publisher:Cengage Learning,