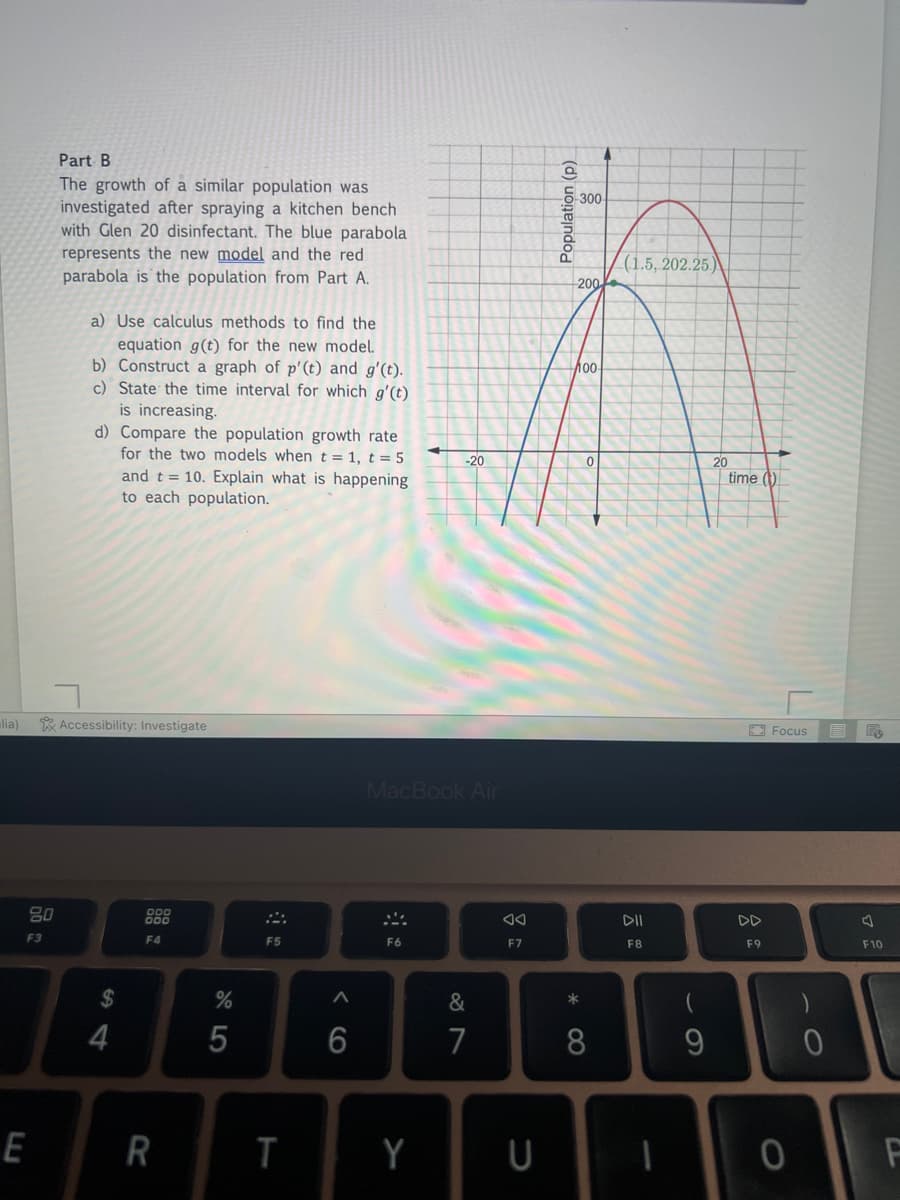
Part B The growth of a similar population was investigated after spraying a kitchen bench with Glen 20 disinfectant. The blue parabola represents the new model and the red parabola is the population from Part A. a) Use calculus methods to find the equation g(t) for the new model. b) Construct a graph of p' (t) and g'(t). c) State the time interval for which g'(t) is increasing. d) Compare the population growth rate for the two models when t = 1, t = 5 and t= 10. Explain what is happening to each population. -20 Population (p) 300- 200 100 0 (1.5, 202.25) 20 time (
Part B The growth of a similar population was investigated after spraying a kitchen bench with Glen 20 disinfectant. The blue parabola represents the new model and the red parabola is the population from Part A. a) Use calculus methods to find the equation g(t) for the new model. b) Construct a graph of p' (t) and g'(t). c) State the time interval for which g'(t) is increasing. d) Compare the population growth rate for the two models when t = 1, t = 5 and t= 10. Explain what is happening to each population. -20 Population (p) 300- 200 100 0 (1.5, 202.25) 20 time (

Algebra & Trigonometry with Analytic Geometry
13th Edition
ISBN:9781133382119
Author:Swokowski
Publisher:Swokowski
Chapter11: Topics From Analytic Geometry
Section11.1: Parabolas
Problem 34E

Related questions
Question
Solve for question d only
Transcribed Image Text:lia)
80
F3
E
Part B
The growth of a similar population was
investigated after spraying a kitchen bench
with Glen 20 disinfectant. The blue parabola
represents the new model and the red
parabola is the population from Part A.
a) Use calculus methods to find the
equation g(t) for the new model.
b) Construct a graph of p' (t) and g'(t).
c) State the time interval for which g'(t)
is increasing.
d) Compare the population growth rate
for the two models when t = 1, t = 5
and t= 10. Explain what is happening
to each population.
Accessibility: Investigate
$
4
800
F4
R
95
%
F5
T
A
6
MacBook Air
F6
-20
Y
&
7
F7
@
300
200
100-
*
0
8
(1.5, 202.25)
DII
F8
(
9
20
time (t)
DD
F9
Focus E
0
0
F10
Expert Solution
This question has been solved!
Explore an expertly crafted, step-by-step solution for a thorough understanding of key concepts.

Step by step
Solved in 2 steps with 1 images

Recommended textbooks for you
Algebra & Trigonometry with Analytic Geometry
Algebra
ISBN:
9781133382119
Author:
Swokowski
Publisher:
Cengage
Algebra & Trigonometry with Analytic Geometry
Algebra
ISBN:
9781133382119
Author:
Swokowski
Publisher:
Cengage