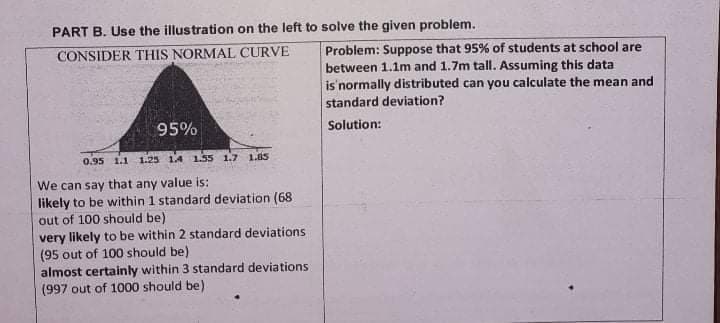
PART B. Use the illustration on the left to solve the given problem. CONSIDER THIS NORMAL CURVE Problem: Suppose that 95% of students at school are between 1.1m and 1.7m tall. Assuming this data is'normally distributed can you calculate the mean and standard deviation? 95% Solution: 0.95 1.1 1.25 14 1.35 1.7 1.15 We can say that any value is: likely to be within 1 standard deviation (68 out of 100 should be) very likely to be within 2 standard deviations (95 out of 100 should be) almost certainly within 3 standard deviations (997 out of 1000 should be)
PART B. Use the illustration on the left to solve the given problem. CONSIDER THIS NORMAL CURVE Problem: Suppose that 95% of students at school are between 1.1m and 1.7m tall. Assuming this data is'normally distributed can you calculate the mean and standard deviation? 95% Solution: 0.95 1.1 1.25 14 1.35 1.7 1.15 We can say that any value is: likely to be within 1 standard deviation (68 out of 100 should be) very likely to be within 2 standard deviations (95 out of 100 should be) almost certainly within 3 standard deviations (997 out of 1000 should be)

Glencoe Algebra 1, Student Edition, 9780079039897, 0079039898, 2018
18th Edition
ISBN:9780079039897
Author:Carter
Publisher:Carter
Chapter10: Statistics
Section10.5: Comparing Sets Of Data
Problem 14PPS

Related questions
Question
Help me answering this, thank you.
Transcribed Image Text:PART B. Use the illustration on the left to solve the given problem.
CONSIDER THIS NORMAL CURVE
Problem: Suppose that 95% of students at school are
between 1.1m and 1.7m tall. Assuming this data
is'normally distributed can you calculate the mean and
standard deviation?
95%
Solution:
0.95 1.1 1.25 1.4 155 1.7 1.8s
We can say that any value is:
likely to be within 1 standard deviation (68
out of 100 should be)
very likely to be within 2 standard deviations
(95 out of 100 should be)
almost certainly within 3 standard deviations
(997 out of 1000 should be)
Expert Solution
This question has been solved!
Explore an expertly crafted, step-by-step solution for a thorough understanding of key concepts.

Step by step
Solved in 2 steps

Recommended textbooks for you
Glencoe Algebra 1, Student Edition, 9780079039897…
Algebra
ISBN:
9780079039897
Author:
Carter
Publisher:
McGraw Hill
Glencoe Algebra 1, Student Edition, 9780079039897…
Algebra
ISBN:
9780079039897
Author:
Carter
Publisher:
McGraw Hill