10.8 [Data Set: AMDREAM] REACHING THE AMERICAN DREAM. Refer to the Even 2019 survey on reaching the "American Dream," Exercise 3.130. Recall that one of the survey questions asked 1,083 Americans to complete the sentence: "When thinking about the American Dream and my own family, I feel..." Responses were categorized as "My family has achieved it", "It is within reach for me", "Somewhat optimistic I will reach it", “Somewhat pessimistic I will reach it", "It is out of reach for me", and "Not sure". The results (category percentages) are summarized in the Minitab pie chart below. a. Identify the categorical variable (and its levels) measured in this study. b. Convert the percentages shown on the pie chart to raw numbers (i.e., to values that represent the number of respondents in each category). c. If the true percentages in each category are equal, how many of the 1,083 responses would you expect to find in each category. d. Specify the null and alternative hypotheses for testing whether the true percentages in each category are equal. e. Calculate the x² test statistic for testing the hypotheses in part d. f. Give the rejection region for the test using a g. Use the results, parts e and f, to make the appropriate conclusion. h. Find and interpret a 95% confidence interval for the proportion of all Americans who feel their family has achieved the American Dream.
10.8 [Data Set: AMDREAM] REACHING THE AMERICAN DREAM. Refer to the Even 2019 survey on reaching the "American Dream," Exercise 3.130. Recall that one of the survey questions asked 1,083 Americans to complete the sentence: "When thinking about the American Dream and my own family, I feel..." Responses were categorized as "My family has achieved it", "It is within reach for me", "Somewhat optimistic I will reach it", “Somewhat pessimistic I will reach it", "It is out of reach for me", and "Not sure". The results (category percentages) are summarized in the Minitab pie chart below. a. Identify the categorical variable (and its levels) measured in this study. b. Convert the percentages shown on the pie chart to raw numbers (i.e., to values that represent the number of respondents in each category). c. If the true percentages in each category are equal, how many of the 1,083 responses would you expect to find in each category. d. Specify the null and alternative hypotheses for testing whether the true percentages in each category are equal. e. Calculate the x² test statistic for testing the hypotheses in part d. f. Give the rejection region for the test using a g. Use the results, parts e and f, to make the appropriate conclusion. h. Find and interpret a 95% confidence interval for the proportion of all Americans who feel their family has achieved the American Dream.

Glencoe Algebra 1, Student Edition, 9780079039897, 0079039898, 2018
18th Edition
ISBN:9780079039897
Author:Carter
Publisher:Carter
Chapter10: Statistics
Section10.3: Measures Of Spread
Problem 1GP

Related questions
Question
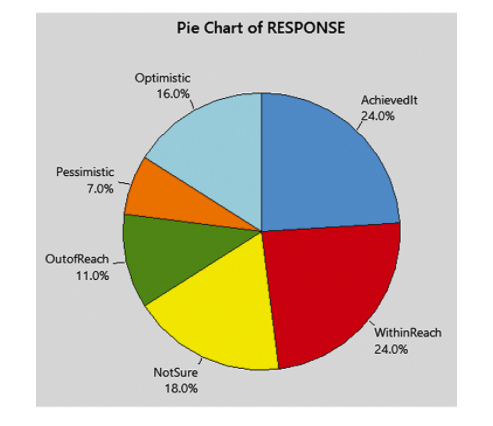
Transcribed Image Text:Pie Chart of RESPONSE
Optimistic
16.0%
Achievedlt
24.0%
Pessimistic
7.0%
OutofReach
11.0%
WithinReach
24.0%
NotSure
18.0%
![10.8
[Data Set: AMDREAM] REACHING THE AMERICAN DREAM. Refer to the
Even 2019 survey on reaching the "American Dream," Exercise 3.130. Recall
that one of the survey questions asked 1,083 Americans to complete the
sentence: "When thinking about the American Dream and my own family, I
feel..." Responses were categorized as "My family has achieved it", "It is within
reach for me", "Somewhat optimistic I will reach it", "Somewhat pessimistic I will
reach it", "It is out of reach for me", and "Not sure". The results (category
percentages) are summarized in the Minitab pie chart below.
a. Identify the categorical variable (and its levels) measured in this study.
b. Convert the percentages shown on the pie chart to raw numbers (i.e., to
values that represent the number of respondents in each category).
c. If the true percentages in each category are equal, how many of the 1,083
responses
would you expect to find in each category.
d. Specify the null and alternative hypotheses for testing whether the true
percentages in each category are equal.
e. Calculate the x? test statistic for testing the hypotheses in part d.
f. Give the rejection region for the test using a = .05.
g. Use the results, parts e and f, to make the appropriate conclusion.
h. Find and interpret a 95% confidence interval for the proportion of all
Americans who feel their family has achieved the American Dream.](/v2/_next/image?url=https%3A%2F%2Fcontent.bartleby.com%2Fqna-images%2Fquestion%2F84408fc5-1239-4470-a834-65edb2f9adb3%2F40359acd-46c8-4f6e-8d4b-a1ff70d2b450%2F8eyzqys_processed.png&w=3840&q=75)
Transcribed Image Text:10.8
[Data Set: AMDREAM] REACHING THE AMERICAN DREAM. Refer to the
Even 2019 survey on reaching the "American Dream," Exercise 3.130. Recall
that one of the survey questions asked 1,083 Americans to complete the
sentence: "When thinking about the American Dream and my own family, I
feel..." Responses were categorized as "My family has achieved it", "It is within
reach for me", "Somewhat optimistic I will reach it", "Somewhat pessimistic I will
reach it", "It is out of reach for me", and "Not sure". The results (category
percentages) are summarized in the Minitab pie chart below.
a. Identify the categorical variable (and its levels) measured in this study.
b. Convert the percentages shown on the pie chart to raw numbers (i.e., to
values that represent the number of respondents in each category).
c. If the true percentages in each category are equal, how many of the 1,083
responses
would you expect to find in each category.
d. Specify the null and alternative hypotheses for testing whether the true
percentages in each category are equal.
e. Calculate the x? test statistic for testing the hypotheses in part d.
f. Give the rejection region for the test using a = .05.
g. Use the results, parts e and f, to make the appropriate conclusion.
h. Find and interpret a 95% confidence interval for the proportion of all
Americans who feel their family has achieved the American Dream.
Expert Solution
This question has been solved!
Explore an expertly crafted, step-by-step solution for a thorough understanding of key concepts.

This is a popular solution!

Trending now
This is a popular solution!

Step by step
Solved in 4 steps with 1 images

Follow-up Questions
Read through expert solutions to related follow-up questions below.
Recommended textbooks for you
Glencoe Algebra 1, Student Edition, 9780079039897…
Algebra
ISBN:
9780079039897
Author:
Carter
Publisher:
McGraw Hill

Holt Mcdougal Larson Pre-algebra: Student Edition…
Algebra
ISBN:
9780547587776
Author:
HOLT MCDOUGAL
Publisher:
HOLT MCDOUGAL
Glencoe Algebra 1, Student Edition, 9780079039897…
Algebra
ISBN:
9780079039897
Author:
Carter
Publisher:
McGraw Hill
Holt Mcdougal Larson Pre-algebra: Student Edition…
Algebra
ISBN:
9780547587776
Author:
HOLT MCDOUGAL
Publisher:
HOLT MCDOUGAL