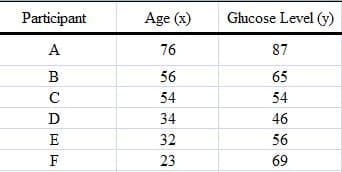
Participant Age (x) Glucose Level (y) A 76 87 B 56 65 C 54 54 D 34 46 E 32 56 F 23 69


Q: 3. James is fitting the linear equation y = }r to a data set. Which scatterplot shows the data set…
A:
Q: In 2013, a company had 20 retail stores. By 2015 it had grown to 36 retail stores. a) Write a linear…
A:
Q: Write the equation of the linear relationship in slope-intercept form, using decimals as needed. x 0…
A: Given table x 0 100 200 300 y 1.5 16.5 31.5 46.5 Here we write the equation of the linear…
Q: The table below relates the number of rats in a population to time in weeks. Use the table to write…
A: From the table we get two coordinates (0,6) and (1,15) Then we use the two-point formula to write…
Q: The table below represents a linear relationship. What is the y intercept? A. b=2 2 3 45 9 10 12 14…
A: Consider the table
Q: Orhan studied the relationship between temperature and sales of refreshments at the concession…
A: The linear equation is always written as, y = ax +b Where 'a' and 'b' are constants.
Q: a²u a?u + Əx2 a²u = 0 əz? %3D ду?
A: The given equation is ∂2u∂x2+∂2u∂y2+∂2u∂z2=0 Ordinary differential equation The equation…
Q: 39. Which equation is not a linear function? A. y= xy + 2 B. y=x+2y y C. y=-x D. y=x- Y + 2
A:
Q: The linear model P = 3.75g + 1.5 predicts the total cost, P, in dollars, to purchase g gallons of…
A: Give data: The given expression for the price is P=3.75g+1.5. The given gallon of gas is g=12.
Q: Meteorologists often measure the intensity of a tropical storm or hurricane by the maximum sustained…
A: Given:- Meteorologists often measure the intensity of a tropical storm or hurricane by the maximum…
Q: The price of pizza 13% delivery charge comes to a total cost of 20.34. what was the total cost of…
A:
Q: The table below relates the number of rats in a population to time in weeks. Use the table to write…
A: Given
Q: Participant Age (x) Glucose Level (y) A 54 65 34 54 C 42 43 D 23 34 E 33 45 F 23 54
A: The straight line linear equation,y=a+bxwhere, a=intercept of the line b=slope of the…
Q: Participant Age (x) Glucose Level (y) A 76 88 B 56 97 54 56 D 45 47 E 67 65 F 54 67
A: Solution: The given data is
Q: Candy The following data represent the weight (in grams of various candy bars and the corresponding…
A: Since you have posted a question with multiple sub-parts, we will solve first three sub-parts for…
Q: The table below shows values of y as a function of x. y 2 8 6 15 10 22 22 43 30 57 Which linear…
A:
Q: The table below relates the number of rats In a population to time in weeks. Use the table to write…
A: Given table is the number of rats in a population to tim in weeks
Q: Find a linear equation that expresses the relationship between the temperature in degrees Celsius Ca…
A:
Q: The school volleyball team is hosting a car wash to raise money for its upcoming season. The coach…
A: Given information: The coach spends $24 on supplies for the car wash. The team plans $6 per car If…
Q: The data below represents how much people use their air conditioner and what their electricity bill…
A: Given data, X Y X*Y X*X 15 225 3375 225 9 185 1665 81 8 165 1320 64 15 198 2970 225…
Q: Years of Education Hourly Wage 8 $6.30 10 $9.70 13 $14.80 Construct a linear equation to…
A: The linear equation to model the given relationship can be taken as follows.
Q: Find a linear equation that expresses the relationship between the temperature in degrees Celsius C…
A: Water freezes at 0°C (32°F) and boils at 100°C (212°F). Use the equation to convert 72°F to degrees…
Q: Write the equation of the linear relationship in slope-intercept form, using decimals as needed. 25…
A:
Q: Find a linear equation that expresses the relationship between the temperature in degrees Celsius C…
A:
Q: Gary is draining his hot tub. The table represents some of the values for the linear relationship…
A: Given Table represents some of the values for the linear relationship between the amount of time…
Q: C. Does the x-y table shown represent a proportional linear relationship? Explain. -2 -1 1 2 y 10 7…
A: Proportional linear relationship
Q: The equation that best describes a linear function is A. y=b В. у%3Dах + b C. y= ax² + bx + c D.…
A: Applying linearity conditions
Q: Participant Age (x) Glucose Level (y) A 56 76 B 54 67 44 66 D 55 45 E 66 54 F 76 53
A: Solution: The given data is
Q: 2500 А. Do you observe a linear relationship between the two variables? 2000 y = 0.3071x + 145.92 R2…
A: Following are the explanation of the question. Yes, There is linear relationship between the two…
Q: Find a linear equation that expresses the relationship between the temperature in degrees Celsius C…
A: The water freezes at 0°C is (32°F) and boils at 100°C (212°F)
Q: A sales manager for an advertising agency believes there is a relationship between the number of…
A: The regression line equation is given by = a + bx
Q: The cost of making 5 handbags is $495. The cost of making 22 handbags is $920. Assume the cost is a…
A: According to the guidelines issued by the company We are supposed to answer only one question.…
Q: Find the equation of the linear function represented by the table below in slope intercept form. y…
A: Given Table x y -2 -4 3 16 8 36 13 56 we find the equation of the linear function in…
Q: Input 'X' Family Median Percentiles OutPut 'Y' Percent Of Children Attending College 100 94 1…
A: The given data is: From the given data, the points on the graph represented by the linear equation…
Q: Write a linear equation which hts data in the table. x-values y-values 1 8. 9. -1 The linear…
A: topic - linear equations
Q: The table shows the average price per pound for honey in the United States from 2009 to 2012. What…
A: Topic : Relationship of Data
Q: The table below relates the number of rats in a population to time in weeks. Use the table to Write…
A:
Q: A researcher for an environmental agency is investigating fuel economy. He has developed a linear…
A: Solution: g=-4.086w+32.96 On comparing with y=mx+c we get, m=−4.086 , where m is the slope c=32.96…
Q: olve: x 1 3 7 9 12, y 4 7 23 31 43 (in a table). find a linear equation that models this data se
A:
Q: . Does the x-y table shown represent a proportional linear relationship? Explain. -2 -1 1 2 10 7 4 1…
A:
Q: Does the x-y table shown represent a proportional linear relationship? Expla -2 -1 1 2 y 10 7 4 1 -2
A:
Q: A Boeing 747 jet takes off from Boston's Logan Airport, which is at sea level, and climbs to a…
A:
Q: The table below relates the number of rats in a population to time in weeks. Use the table to write…
A:
Q: School Attendance PE Grade 100 95 96 80 86 77 65 74 77 90 51 30 a. Write a linear equation that fits…
A: Since the question has multiple sub parts we will solve the first three sub parts. Please resend the…
Q: A small business purchases a piece of equipment for $465. After 3 years the equipment will be…
A: We will solve the problem.
Q: The table below shows a linear relationship between the values of x and y. X y 1 1 2 11 4 16 Based…
A:
Q: The data in the table represent the relative distance, in miles, between a car and a particular mile…
A:
Q: Write the equation of the linear relationship in slope-intercept form, using decimals as needed. x |…
A: Consider the given table
Q: Which scenario is the best fit for the linear equation? y=200x +1200
A:
Q: Does the x-y table shown represent a proportional linear relationship? Explain. -2 -1 1 y. 10 7 4 1…
A: We have to show that whether the given x-y table represents a proportional linear relationship.
Use the information in the table below to determine the linear equation as expressed as y = a + bx.

Step by step
Solved in 2 steps with 5 images


- Specificity of the association is best described as A. when the value of the response variable changes in a meaningful way with the dosage of the suspected cause. B. when the suspected cause precedes the response variable. C. when similar studies produce similar results. D. when all other possible causes are ruled out.[Econometrics] The World Bank hires you to analyze the effect of the introduction of new irrigation systems in a series of Sub-Saharan African countries. They are particularly interested on their effect in the crop production of each country. They give you data for each country on the kilometers of irrigation tubes constructed, the total crop harvest, as well as information on the average educational attainment for each year between 2000 and 2017. Which type of analysis would you perform based on this information?Statistical interference
- 2. Motor vehicle collision is one of major causes of death in North America. Although the causes of motor vehicle collisions are complicated, many believe that cellular telephones while driving may contribute to collisions by distracting drivers. In order to test the hypothesis that using a cellular telephone while driving increases the risk of a motor vehicle collision. An observational epidemiological study was proposed to assess the association. If you are the principal investigator of the project, a. What type of observational study would be ideal to study this hypothesis? b. Why do you recommend this study design?Empirical rule usestatistical
- Osteoporosis is a degenerative disease that primarily affects women over the age of 60. A research analyst wants to forecast sales of StrongBones, a prescription drug for treating this debilitating disease. She uses the model Sales = β0 + β1Population + β2Income + ε, where Sales refers to the sales of StrongBones (in $1,000,000s), Population is the number of women over the age of 60 (in millions), and Income is the average income of women over the age of 60 (in $1,000s). She collects data on 38 cities across the United States and obtains the following regression results: Coefficients StandardError t Stat p-Value Intercept 10.35 4.02 2.57 0.0199 Population 8.47 2.71 3.12 0.0062 Income 7.62 6.63 1.15 0.2661 a. What is the sample regression equation? (Enter your answers in millions rounded to 2 decimal places.) b-1. Interpret the coefficient of population. multiple choice 1 As the number of women over the age of 60 increases by 1 million, sales of StrongBones…TEST OF HYPOTHESISDirection: State when the error will be committed and give its possible consequences. An airline company does regular quality control checks on airplanes. One of them is tire inspection because tires are sensitive to the heat produced when the airplane runs through the runway. Since its operation, the company uses a particular type of tire which is guaranteed to perform even at a maximum surface temperature of 107oC. However, the tires cannot be used and need to be replaced when surface temperature exceeds a mean of 107oC. Help the company decide whether or not to do a complete tire replacement.Decreasing the alpha level (for example from = .05 to = .01) ____. a Decreases the probability of a Type I error b Decreases the size of the critical region c Decreases the probability that the sample will fall into the critical region d All of the other options are results of decreasing alpha.
- Homogeneity occurs when occurs when there is not variability in a sample there is a nonlinear relationship between the X and Y scores. the variability between the populations of interest are the same occurs when there is no variability in a populationTwo Factor ANOVA How do i fill in the missing values on the chart and find out if the interaction is significant?Nexium is a drug that can be used to reduce the acid produced by the body and heal damage to the esophagus. A researcher wants to estimate the proportion of patients taking Nexium that are healed within 8 weeks. A random sample of 224 patients suffering from acid reflux disease is obtained, and 213 of those patients were healed after 8 weeks. a. Identify the population of interest and sample of interest. what is the sample size? b. Describe the parameter of interest. c. Describe the statistic of interest. What value of the statistic obtained?