Pew research asked random sample of 1000 US adults whether they supported increased usage of coal to produce energy. They found that 37% did support increase usage of coal. In this example of a two-sided test for significance, so the hypotheses are: H0: π = 0.5 Ha: π ≠ 0.5 In this problem, you will explore what changes if we use π < 0.5 or π > 0.5 as our alternative hypothesis instead. A. Produce a sampling distribution sketch, shade the area corresponding to the p value if the alternative hypothesis is π ≠ 0.5, and find the p value. B. In the second sampling distribution sketch, shade the area corresponding to the p value if the alternative hypothesis is π < 0.5, and find the p value. C. In the third sampling distribution sketch, shade the area corresponding to the p value if the alternative hypothesis is π > 0.5, and find the p value. NB: The attached image is the original sampling distribution sketch, with the test statistics
Pew research asked random sample of 1000 US adults whether they supported increased usage of coal to produce energy. They found that 37% did support increase usage of coal. In this example of a two-sided test for significance, so the hypotheses are: H0: π = 0.5 Ha: π ≠ 0.5 In this problem, you will explore what changes if we use π < 0.5 or π > 0.5 as our alternative hypothesis instead. A. Produce a sampling distribution sketch, shade the area corresponding to the p value if the alternative hypothesis is π ≠ 0.5, and find the p value. B. In the second sampling distribution sketch, shade the area corresponding to the p value if the alternative hypothesis is π < 0.5, and find the p value. C. In the third sampling distribution sketch, shade the area corresponding to the p value if the alternative hypothesis is π > 0.5, and find the p value. NB: The attached image is the original sampling distribution sketch, with the test statistics

Algebra & Trigonometry with Analytic Geometry
13th Edition
ISBN:9781133382119
Author:Swokowski
Publisher:Swokowski
Chapter10: Sequences, Series, And Probability
Section10.8: Probability
Problem 32E

Related questions
Question
Pew research asked random sample of 1000 US adults whether they supported increased usage of coal to produce energy. They found that 37% did support increase usage of coal.
In this example of a two-sided test for significance, so the hypotheses are:
H0: π = 0.5
Ha: π ≠ 0.5
In this problem, you will explore what changes if we use
π < 0.5 or π > 0.5 as our alternative hypothesis instead.
A. Produce a sampling distribution sketch, shade the area corresponding to the p value if the alternative hypothesis is
π ≠ 0.5, and find the p value.
B. In the second sampling distribution sketch, shade the area corresponding to the p value if the alternative hypothesis is
π < 0.5, and find the p value.
C. In the third sampling distribution sketch, shade the area corresponding to the p value if the alternative hypothesis is
π > 0.5, and find the p value.
NB: The attached image is the original sampling distribution sketch, with the test statistics
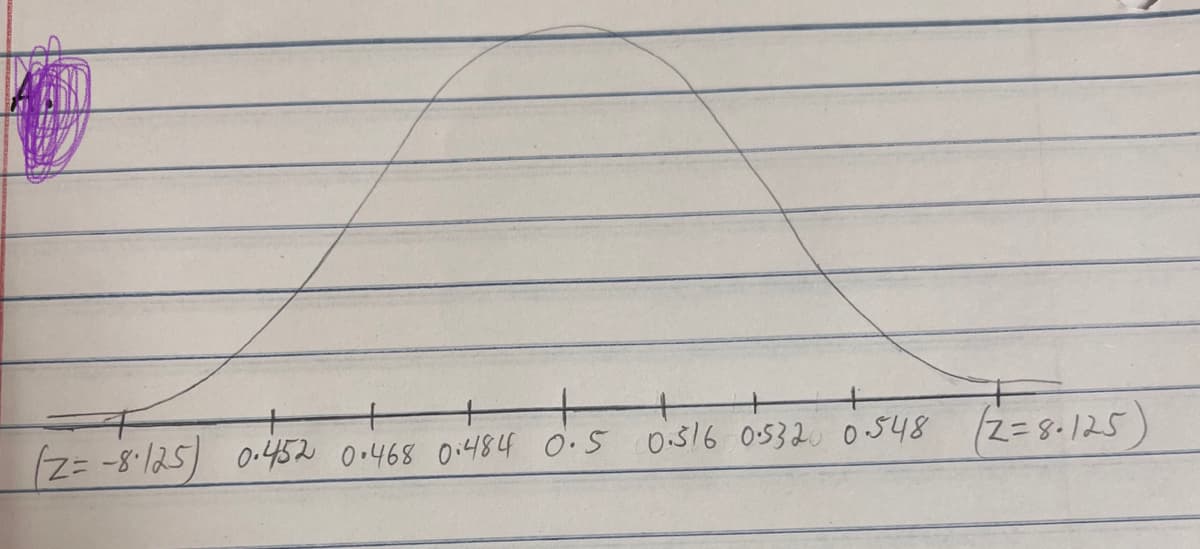
Transcribed Image Text:+
(z%=8))25) 0-452 o+468 0.484 0.s o516 0532 0548 z=8.125)
Expert Solution
This question has been solved!
Explore an expertly crafted, step-by-step solution for a thorough understanding of key concepts.

Step by step
Solved in 2 steps with 3 images

Recommended textbooks for you
Algebra & Trigonometry with Analytic Geometry
Algebra
ISBN:
9781133382119
Author:
Swokowski
Publisher:
Cengage

Holt Mcdougal Larson Pre-algebra: Student Edition…
Algebra
ISBN:
9780547587776
Author:
HOLT MCDOUGAL
Publisher:
HOLT MCDOUGAL

Trigonometry (MindTap Course List)
Trigonometry
ISBN:
9781337278461
Author:
Ron Larson
Publisher:
Cengage Learning
Algebra & Trigonometry with Analytic Geometry
Algebra
ISBN:
9781133382119
Author:
Swokowski
Publisher:
Cengage
Holt Mcdougal Larson Pre-algebra: Student Edition…
Algebra
ISBN:
9780547587776
Author:
HOLT MCDOUGAL
Publisher:
HOLT MCDOUGAL
Trigonometry (MindTap Course List)
Trigonometry
ISBN:
9781337278461
Author:
Ron Larson
Publisher:
Cengage Learning

College Algebra
Algebra
ISBN:
9781305115545
Author:
James Stewart, Lothar Redlin, Saleem Watson
Publisher:
Cengage Learning

Algebra and Trigonometry (MindTap Course List)
Algebra
ISBN:
9781305071742
Author:
James Stewart, Lothar Redlin, Saleem Watson
Publisher:
Cengage Learning