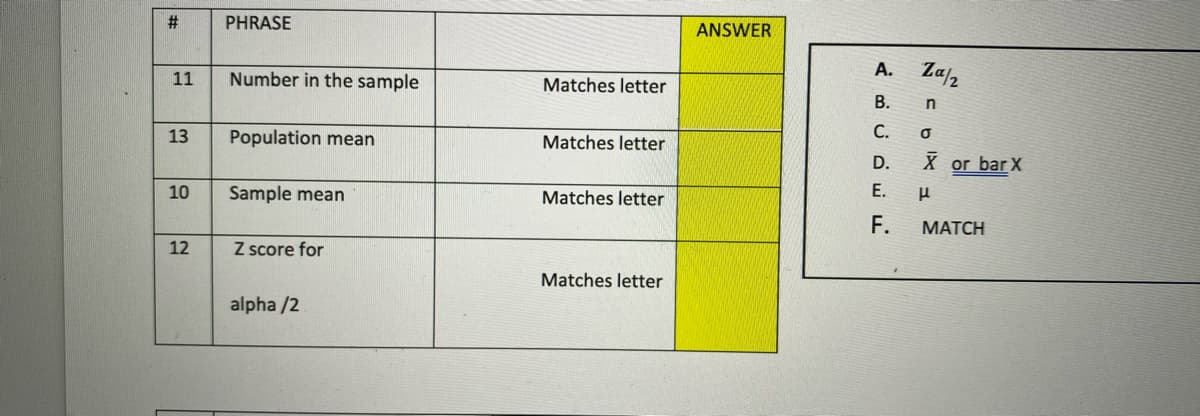
PHRASE ANSWER Number in the sample A. Za, 11 Matches letter В. 13 Population mean Matches letter С. D. X or bar X 10 Sample mean Matches letter E. F. МАТСH 12 Z score for Matches letter alpha /2


Q: The manager of a bank with 50,000 customers commissions a survey to gauge customer views on internet…
A: i. The set or collection of all possible observations is defined as the population.
Q: Bacterial contamination of surgical patients can occur from bacteria that contaminate the scrub…
A: A quartile defined as a special type of quantile which divides the number of data points into four…
Q: The Canine Gourmet Company produces delicious dog treats for canines with discriminating tastes.…
A: Solution: Given information: X= 42 Process average R = 6 Process average range n= 8 sample size…
Q: Freshmen Seniors Sample size 80 70 Sample mean $460 $440 Population std. dev. $52 $63
A:
Q: 1. A t-test would be appropriate for which sample sizes? 1000, 50, 0 or 15?
A: When, the sample size is large, we can use the Central Limit Theorem and assume that the parent…
Q: Calculate value of (t) if: first sample mean = 85, second sample mean = 91, and o x1-x2 =
A: We want to findvalue of t
Q: 21% of deaths among male adults can be attributed to heart diseases. Is this percentage different…
A: Given that : 21% of deaths among male adults can be attributed to heart diseases. Is this percentage…
Q: Twenty years ago, 53% of parents of children in high school felt it was a serious problem that high…
A:
Q: What is the alternative hypothesis in the problem? The average family family size in the Philippines…
A: Given The average family size in the philippines was reported as 4.30 Mean=μ=4.30 l.o.s.=α=0.10
Q: Compute the mean of each sample and the mean of the sample means.
A: The sample mean for each sample can be calculated as Mean = Sum of observations/Sample size.
Q: HI! HELP ME WITH THIS PLEASE. TYSM! The average length of a flight by regional airlines in the…
A:
Q: Suppose we conducted a survey, and found that of 600 people sampled, 384 preferred Candidate A. We…
A: Given information: Here, there are 600 sample pf people and 384 preferred candidate. We are…
Q: A researcher is trying to determine whether boys or girls in the 7th grade, paired up by height, can…
A: In the given problem, a researcher trying to determine whether the boys or girls in the 7th grade,…
Q: the unemployment rate for 18- to 34-year-olds was reported to be 10.8% (the CincinnatiEnquirer,…
A: a.
Q: hi i need help to calculate this statistics on manual calculations. this is the 5 question, A study…
A: hi i need help to calculate this statistics on manual calculations. this is the 5 question, A study…
Q: What statistical test should she use to analyze the data? a. Paired t-test b. One Way ANOVA c.…
A: Answer: Given that, The Superintendent of Schools wants to examine whether there are differences in…
Q: Do the sample data provide strong support for the claim that the mean salary offer for accounting…
A: To test if the sample data provides strong support for the claim that the mean salary offer for…
Q: b. Alpha is 10%, the sample size is 45 and sigma is known.
A:
Q: At the particular courthouse, to increase his or her honor's statistical power, a judge can 1.…
A: Power of the test: Power of the test is defined as the probability of rejecting the null hypothesis…
Q: Past records indicate that 45% of students eat breakfast while driving to school. A campaign to…
A: Solution: State the hypotheses Null hypothesis: That is, the proportion of students eats breakfast…
Q: First quartile Q1
A: Since , the sample data is given by 12,31,11,45,33,44,9,47,4,36,2,26 We want to find the first…
Q: 26 randomly selected students were asked the number of movies they watched the previous week. The…
A: Quartile formula for grouped data Quartiles are the values of arranged data which divide whole data…
Q: fire insurance company thought that the mean distance from a home to the nearest fire department in…
A: The provided sample mean is Xˉ=4.8\bar X = 4.8 and the known population standard deviation is…
Q: the unemployment rate for 18- to 34-year-olds was reported to be 10.8% (the CincinnatiEnquirer,…
A: From provided information, the unemployment rate for 18- to 34-year-olds was reported to be 10.8%.…
Q: The personality trait of "Conscientiousness" (someone who is organized, responsible, and can control…
A:
Q: 2. The principal of a high school wants to know how long his students spend doing homework at night…
A: Since you have posted a question with multiple subparts we will solve first three subparts for you.…
Q: A professor is curious about the IQ of students at the Mindanao State University. The entire group…
A: We tell the entire group students is an example of a Note: According to bartleby experts question…
Q: Automobile insurance is much more expensive for teenage drivers than for older drivers. To justify…
A: Given: Sample size, n = 300 Under age 20 Age 20-29 Age 30 or older Observed…
Q: A high school guidance counselor is interested in the strength of relationship between proximity to…
A: counselor wants to know the strength of relationship between proximity to school and participation…
Q: - Suppose the Department of Energy in the Philippines surveyed 200 gasoline stations to determine…
A: a)In the given case, gasoline at all the gas stations is the population whereas the gas stations…
Q: Twenty years ago, 54% of parents of children in high school felt it was a serious problem that high…
A: From the provided information, Sample size (n) =750 and p0 = 0.54
Q: when we are performing a hypothesis testing for a population mean, if the sample size is small, what…
A: For hypothesis testing of the population mean of the small samples (<30) t-statistic is used.…
Q: determine the standardized test statistic,z to test the claim about the population proportion…
A:
Q: With a paired-samples t test, you will usually compare the sample mean for the difference score to…
A: Paired t test: The mean of the same group at different times are compared. That is, sometimes…
Q: Adults aged 18 years old and older were randomly selected for a survey on obesity. Adults are…
A: From the given information, The number who are obese Sample size Men 2766 155525 Women…
Q: A national study report indicated that 20.5% of Americans were identified as having medical bill…
A: Given: n= 400 ,x= 95.0 p= 0.205 p̂= 95 / 400
Q: A marketing agency wanted to determine if a new commercial changed people's opinion about a company.…
A: Statistical hypothesis means the decision about a population parameter. Here we look at the data we…
Q: Twenty years ago, 52% of parents of children in high school felt it was a serious problem that high…
A: The value of p0 is 0.52 and the sample size n is 800.
Q: According to a polling organization, 22% of adults in a large region consider themselves to be…
A: Given Information: Hypothesized value of population proportion p0=0.22 Sample size n=200 From the…
Q: 14. A Blu-ray manufacturer knows that the disks are supposed to have a diameter of 120mm. An…
A: xbar = 120.07 mu = 120
Q: A teacher wants to know if there is a significant difference in reading ability between a sample of…
A: An appropriate choice of the test is to be adopted in order to test the claim of difference in the…
Q: Average college cost of tuition fee for all private institutions last year was P36, 400. A random…
A: Step 1: Null Hypothesis: H0: There is no sufficient evidence to conclude that the cost is greater…
Q: A team of researchers would like to determine whether the number of households that use the internet…
A: The correct option is ‘these samples are independent’.Explanation: The two samples which are derived…
Q: A study was conducted to see of airbags save lives. The table below lists the results from a simple…
A: The payoff table is a representation of data where one can easily find the conditional distribution…
Q: Find the p-value of the one-sided y2 -test with 20.09 value of the test statistic and a sample size…
A:
Q: A sample of 150 married women determined that 127 are happy in their marriage. A sample of 150…
A: As per our guidelines I can solve only first 3 subparts. Post the remaining subparts again and…
Q: A researcher deciding to increase the desired sample size from n = 25 to n = 100 prior to collecting…
A: Given that: A researcher wants to Increase the size of the sample from n =25 to n=100 prior of the…
Q: A random sample of size 21 was taken from a normal population. The sample average was 9.87 and the…
A:
Q: The U.S. Department of Transportation, National Highway Traffic Safety Administration, reported that…
A: We have to find level of significant Sample Statastics And p value...

Step by step
Solved in 2 steps


- Two popular brands of tires for tractor-trailers are the Puma and the Eternal. Christine is a buyer for a major shipping company and wants to determine if there is any difference between the two brands of tire in the mean distance (in thousands of km ) driven on them before they need to be replaced. In the company's testing lab, Christine tests a random sample of 13 Puma tires and a random sample of 15 Eternal tires. (These samples are chosen independently.) For the Puma tires, the sample mean distance (in thousands of km ) until they would need to be replaced is 62.12 with a sample variance of 11.55 . For the Eternal tires, the sample mean distance (in km ) until they would need to be replaced is 55.43 with a sample variance of 75.98 . Assume that the two populations of distances driven are approximately normally distributed. Can Christine conclude, at the 0.05 level of significance, that there is a difference between the population mean of the…A physician is interested to determine if the mean length of waiting time to conceive (in months) of married women in urban and rural areas is the same. She randomly selected 10 married women in each area matched according to age at marriage and party. The length of waiting time to conceive since data of marriage or date of last birth delivery was recorded. What type of sample was used? - independent - objective - related - subjectiveThe manager of Microsoft wants to study the # of hours per week employees spend at their desktop computers by type of industry. The manager randomly selected a sample of 5 executives from each of 3 industries studied. At the 0.05 siginificance level, can she conclude there is a difference in the mean number of hours spent per week by industry? Construction - 12, 10, 10, 12, 10 Energy - 8, 8, 6, 8, 10 Manufacturing - 10, 8, 6, 8, 10 What is the decision rule? (round 2 decimal places) (F 0.05 > ?) Complete the ANOVA Table: Source SS df MS F Treatments Error
- A fire insurance company thought that the mean distance from a home to the nearest fire department in a suburb of Chicago was at least 4.5 miles. It set its fire insurance rates accordingly. Members of the community set out to show that the mean distance was less than 4.5 miles. This, they thought, would convince the insurance company to lower its rates. They randomly indentified 52 homes and measured the distance to the nearest fire department from each. The resulting sample mean was 3.7. If ? = 2.1 miles, does the sample show sufficient evidence to support the community's claim at the ? = .05 level of significance? (a) Find z. (Give your answer correct to two decimal places.)(ii) Find the p-value. (Give your answer correct to four decimal places.)(b) State the appropriate conclusion. Reject the null hypothesis, there is not significant evidence that the mean distance is less than 4.5 miles.Reject the null hypothesis, there is significant evidence that the mean distance is less than…Suppose an instructor wants to know the average height, gender distribution, academic performance (bad, good, very good, excellent), and year of admission of the Students. He divided the students into male and female and took a random sample of 30 male and 30 female students.i) Identify the level of measurement of each identified variableii) Which sampling technique was used to select 60 students?Compute the mean, median, and mode of the data sample. (If every number of the set is a solution, enter EVERY in the answer box.) 3, 1, 7, −4, 0, 5 mean median mode
- Students from TarlacElementarySchool got scores of91, 91, 99, 94, 94, 92, 93, 92, 94, 95, 89, 92,99, 92, 93, 94, 91, 92, 93, 92, 91,94, and 95. Construct a frequency distribution table, find the mean, mode, range, variance, and standarddeviation.100 students was required to estimate the mean achievement in research of graduatestudents. The average graduate students in the city’s universities and colleges is 20students. Thus, 5 universities or colleges were randomly selected and all graduatestudents under graduate program with thesis were assessed. What sampling methodwas used?A landscaping company hypothesizes that the median number of lawns they mow in a weekend is 20. They tabulated the number of lawns mowed in a random sample of 14 weekends. State the test value. 22, 18,19, 20, 25, 20,18, 22, 23, 20, 21, 26, 24, 22
- A cardiologist is interested in the mean recovery time of her patients who have had heart attacks. Suppose the cardiologist has a total of 52 patients and among those, 30 patients have had heart attacks. The study records 10 patients' recovery times, what is the sample size? 10 None of the above 52 3A nationwide job recruiting firm wants to compare the annual incomes for childcare workers in Texas and Indiana. Due to recent trends in the childcare industry, the firm suspects that the mean annual income of childcare workers in Texas is less than the mean annual income of childcare workers in Indiana. To see if this is true, the firm selected a random sample of 20 childcare workers from Texas and an independent random sample of 20 childcare workers from Indiana and asked them to report their mean annual income. The data obtained were as follows. Annual income in dollars Texas 37093 , 33960 , 35692 , 29528 , 30978 , 35504 , 26961 , 28380 , 37537 , 25341 , 34837 , 36489 , 33633 , 41229 , 43577 , 27644 , 43364 , 28415 , 28919 , 34096 Indiana 33672 , 46452 , 35900 , 28486 , 46528 , 34252 , 40952 , 42164 , 36298 , 38828 , 32690 , 29157 , 42770 , 35527 , 40804 ,…John Calipari, head basketball coach for the 2012 national championuniversity of Kentucky Wildcats, is the highest paid coach in collegebasketball with an annual salary of $5.4 million (USA Today, March 29,2012). The sample attached shows the head basketball coach's salary for asample of 10 schools playing NCAA Division I basketball. Salary data arein millions of dollars. a. Use the sample mean for the 10 schools to estimate thepopulation mean annual salary for head basketball coaches atcolleges and universities playing NCAA Division I basketball.b. Use the data to estimate the population standard deviation for the annual salary for head basketball coaches.c. What is the 95% confidence interval for the population variance?d. What is the 95% confidence interval for the population standarddeviation?
