pla gav 0.251 0.263 0.239 1.0 0.299 5.0 0.286 0.268 0.339 3.3 5.5 3.8 3.5 7.3 USE SALT catter diagram of the data. O 0.34 .
pla gav 0.251 0.263 0.239 1.0 0.299 5.0 0.286 0.268 0.339 3.3 5.5 3.8 3.5 7.3 USE SALT catter diagram of the data. O 0.34 .

Glencoe Algebra 1, Student Edition, 9780079039897, 0079039898, 2018
18th Edition
ISBN:9780079039897
Author:Carter
Publisher:Carter
Chapter10: Statistics
Section10.4: Distributions Of Data
Problem 19PFA

Related questions
Question
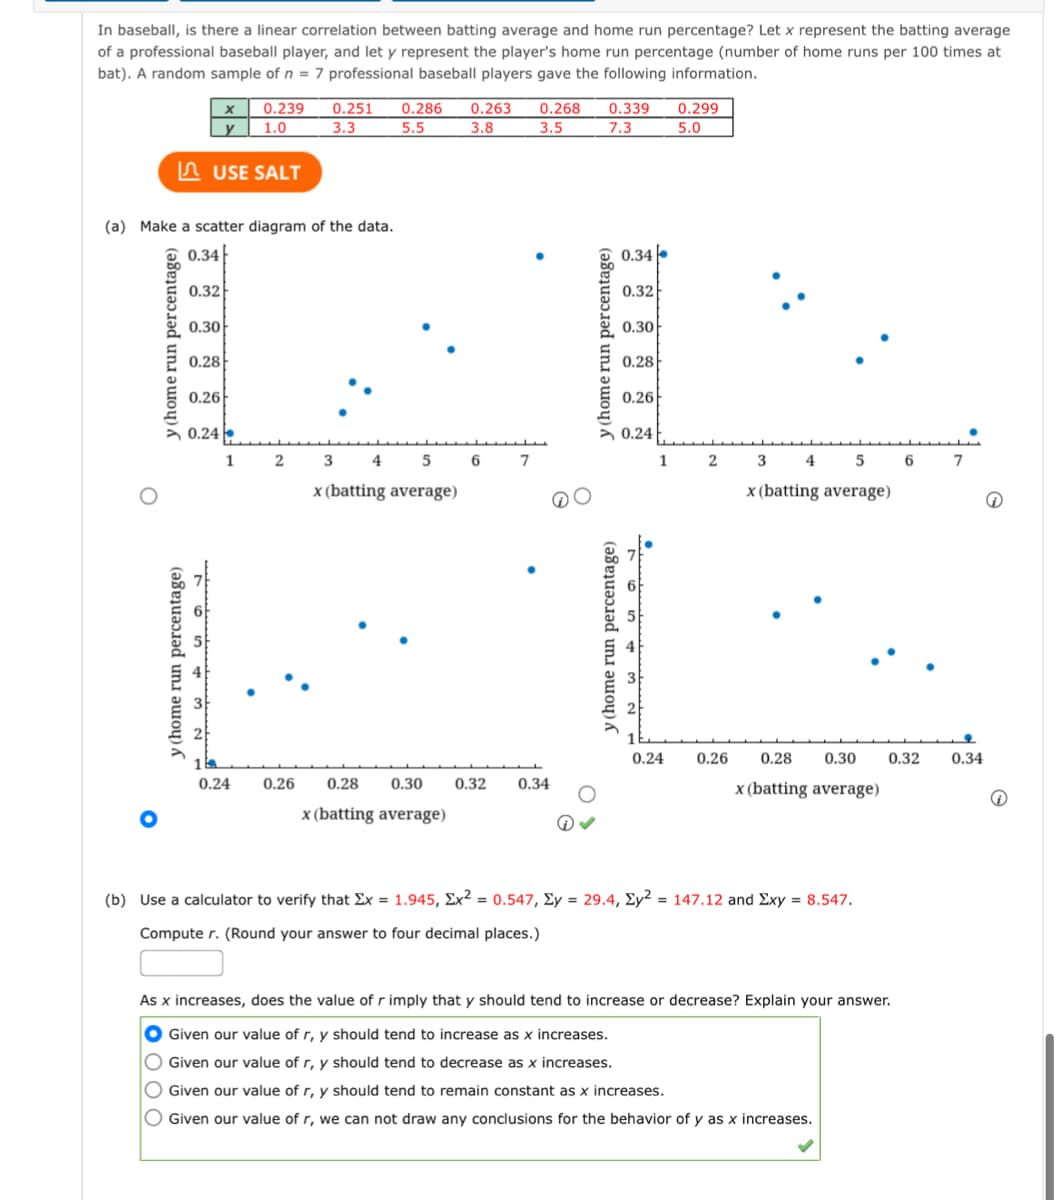
Transcribed Image Text:In baseball, is there a linear correlation between batting average and home run percentage? Let x represent the batting average
of a professional baseball player, and let y represent the player's home run percentage (number of home runs per 100 times at
bat). A random sample of n = 7 professional baseball players gave the following information.
0.239
1.0
3.3
0.251
0.286
0.263
0.268
0.339
0.299
5.5
3.8
3.5
7.3
5.0
n USE SALT
(a) Make a scatter diagram of the data.
0.34
0.34
0.32
0.32
0.30
0.30
0.28
0.28
0.26
0.26
> 0.24
> 0.24
1 2
3
4 5
6 7
1 2
4 5
6 7
x (batting average)
x (batting average)
0.24
0.26
0.28
0.30
0.32
0.34
0.24
0.26
0.28
0.30
0.32
0.34
x (batting average)
x (batting average)
(b) Use a calculator to verify that Ex = 1.945, Ex² = 0.547, Ey = 29.4, Ey² = 147.12 and Exy = 8.547.
Compute r. (Round your answer to four decimal places.)
As x increases, does the value of r imply that y should tend to increase or decrease? Explain your answer.
Given our value of r, y should tend to increase as x increases.
O Given our value of r, y should tend to decrease as x increases.
O Given our value of r, y should tend to remain constant as x increases.
O Given our value of r, we can not draw any conclusions for the behavior of y as x increases.
y (home run percentage)
y (home run percentage)
y(home run percentage)
y (home run percentage)
Expert Solution
This question has been solved!
Explore an expertly crafted, step-by-step solution for a thorough understanding of key concepts.

Step by step
Solved in 2 steps with 1 images

Recommended textbooks for you
Glencoe Algebra 1, Student Edition, 9780079039897…
Algebra
ISBN:
9780079039897
Author:
Carter
Publisher:
McGraw Hill
Glencoe Algebra 1, Student Edition, 9780079039897…
Algebra
ISBN:
9780079039897
Author:
Carter
Publisher:
McGraw Hill