p. D p. 171 173 174 0.86 1.25 1.46 181 181 181 175 0.95 181

Algebra & Trigonometry with Analytic Geometry
13th Edition
ISBN:9781133382119
Author:Swokowski
Publisher:Swokowski
Chapter7: Analytic Trigonometry
Section7.6: The Inverse Trigonometric Functions
Problem 91E

Related questions
Question
100%
STATISTICS(UPVOTE WILL BE GIVEN. PLEASE ANSWER THE FOLLOWING PROBLEMS. FOLLW THE INSTRUCTION CAREFULLY NO LONG EXPLANATION NEEDED. BOX THE FINAL ANSWERS.)
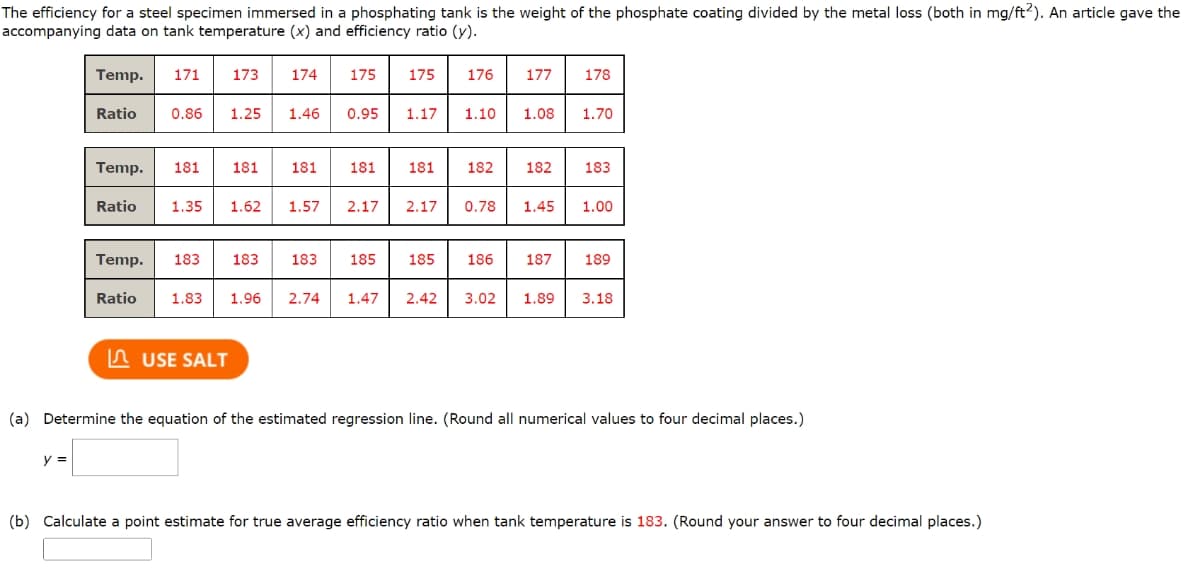
Transcribed Image Text:The efficiency for a steel specimen immersed in a phosphating tank is the weight of the phosphate coating divided by the metal loss (both in mg/ft2). An article gave the
accompanying data on tank temperature (x) and efficiency ratio (y).
Temp. 171
y =
Ratio
Ratio
173 174
0.86 1.25 1.46
Temp. 181 181
Temp. 183 183
175 175
USE SALT
0.95
1.35 1.62 1.57 2.17
181 181
183 185
1.17
181
176
185
177 178
1.10 1.08 1.70
182
182 183
2.17 0.78 1.45 1.00
186 187 189
Ratio 1.83 1.96 2.74 1.47 2.42 3.02 1.89 3.18
(a) Determine the equation of the estimated regression line. (Round all numerical values to four decimal places.)
(b) Calculate a point estimate for true average efficiency ratio when tank temperature is 183. (Round your answer to four decimal places.)
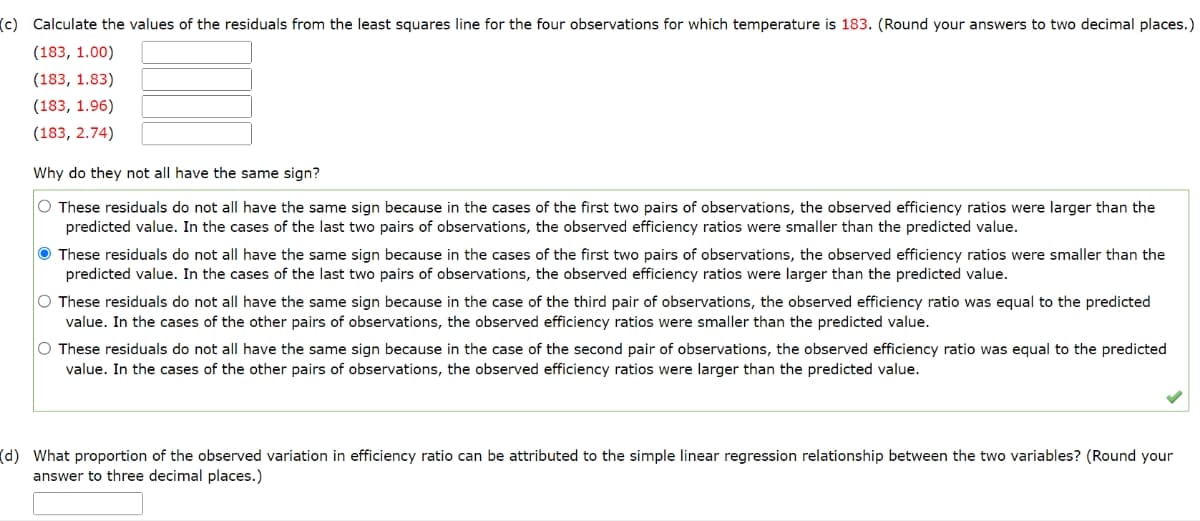
Transcribed Image Text:(c) Calculate the values of the residuals from the least squares line for the four observations for which temperature is 183. (Round your answers to two decimal places.)
(183, 1.00)
(183, 1.83)
(183, 1.96)
(183, 2.74)
Why do they not all have the same sign?
O These residuals do not all have the same sign because in the cases of the first two pairs of observations, the observed efficiency ratios were larger than the
predicted value. In the cases of the last two pairs of observations, the observed efficiency ratios were smaller than the predicted value.
These residuals do not all have the same sign because in the cases of the first two pairs of observations, the observed efficiency ratios were smaller than the
predicted value. In the cases of the last two pairs of observations, the observed efficiency ratios were larger than the predicted value.
O These residuals do not all have the same sign because in the case of the third pair of observations, the observed efficiency ratio was equal to the predicted
value. In the cases of the other pairs of observations, the observed efficiency ratios were smaller than the predicted value.
O These residuals do not all have the same sign because in the case of the second pair of observations, the observed efficiency ratio was equal to the predicted
value. In the cases of the other pairs of observations, the observed efficiency ratios were larger than the predicted value.
(d) What proportion of the observed variation in efficiency ratio can be attributed to the simple linear regression relationship between the two variables? (Round your
answer to three decimal places.)
Expert Solution
This question has been solved!
Explore an expertly crafted, step-by-step solution for a thorough understanding of key concepts.

This is a popular solution!

Trending now
This is a popular solution!

Step by step
Solved in 2 steps with 1 images

Follow-up Questions
Read through expert solutions to related follow-up questions below.
Follow-up Question
Please answer letter "d". Upvote will bbe given!
Solution
Recommended textbooks for you
Algebra & Trigonometry with Analytic Geometry
Algebra
ISBN:
9781133382119
Author:
Swokowski
Publisher:
Cengage


Trigonometry (MindTap Course List)
Trigonometry
ISBN:
9781337278461
Author:
Ron Larson
Publisher:
Cengage Learning
Algebra & Trigonometry with Analytic Geometry
Algebra
ISBN:
9781133382119
Author:
Swokowski
Publisher:
Cengage
Trigonometry (MindTap Course List)
Trigonometry
ISBN:
9781337278461
Author:
Ron Larson
Publisher:
Cengage Learning

Big Ideas Math A Bridge To Success Algebra 1: Stu…
Algebra
ISBN:
9781680331141
Author:
HOUGHTON MIFFLIN HARCOURT
Publisher:
Houghton Mifflin Harcourt

Functions and Change: A Modeling Approach to Coll…
Algebra
ISBN:
9781337111348
Author:
Bruce Crauder, Benny Evans, Alan Noell
Publisher:
Cengage Learning

Algebra: Structure And Method, Book 1
Algebra
ISBN:
9780395977224
Author:
Richard G. Brown, Mary P. Dolciani, Robert H. Sorgenfrey, William L. Cole
Publisher:
McDougal Littell