Please answer the last 2 questions.

Elementary Linear Algebra (MindTap Course List)
8th Edition
ISBN:9781305658004
Author:Ron Larson
Publisher:Ron Larson
Chapter2: Matrices
Section2.5: Markov Chain
Problem 36E: Customer Preference Two movie theatres that show several different movies each night compete for the...

Related questions
Topic Video
Question
Please answer the last 2 questions.
Transcribed Image Text:O < >
A myopenmath.com
MyOpenMath
b Answered: 40 married couples without children are... | bartleby
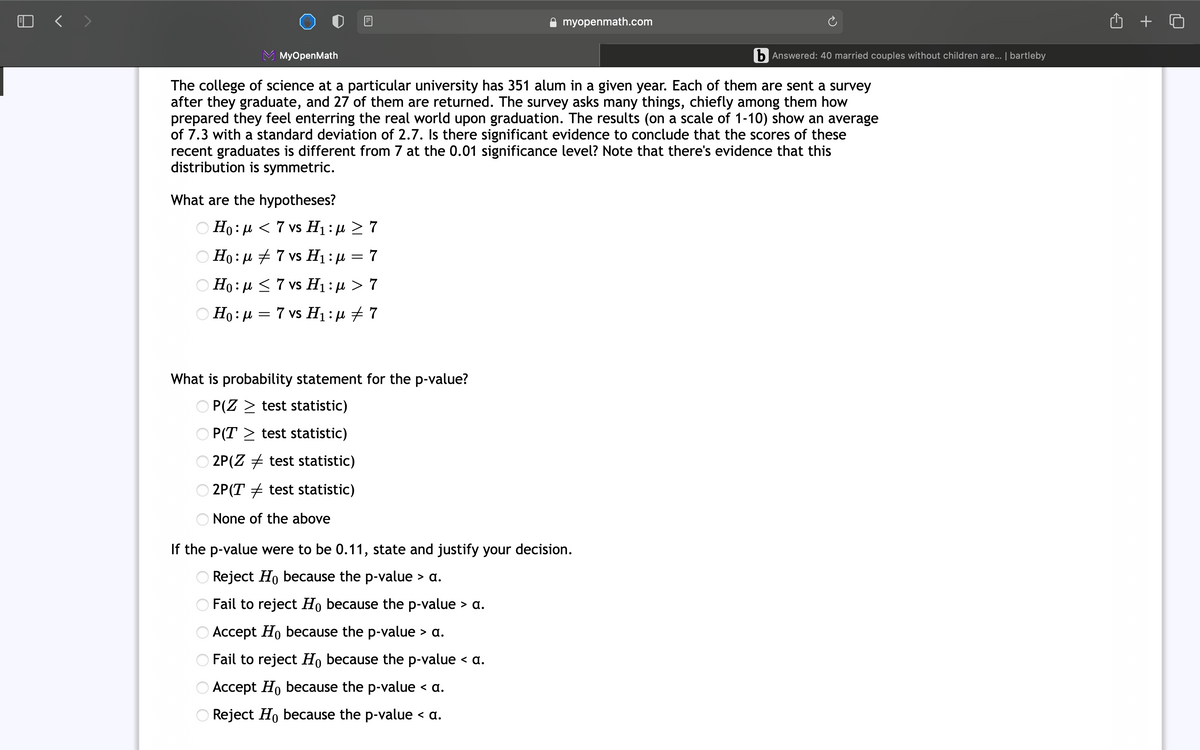
The college of science at a particular university has 351 alum in a given year. Each of them are sent a survey
after they graduate, and 27 of them are returned. The survey asks many things, chiefly among them how
prepared they feel enterring the real world upon graduation. The results (on a scale of 1-10) show an average
of 7.3 with a standard deviation of 2.7. Is there significant evidence to conclude that the scores of these
recent graduates is different from 7 at the 0.01 significance level? Note that there's evidence that this
distribution is symmetric.
What are the hypotheses?
Ο Η: μ < 7 vs Η: μ 7
Ο H0: μ 7 vs H1 : μ 7
O Ho: µ <7 vs H1:µ > 7
O Ho: µ = 7 vs H1 : µ + 7
What is probability statement for the p-value?
O P(Z > test statistic)
P(T > test statistic)
O 2P(Z + test statistic)
2P(T + test statistic)
None of the above
If the p-value were to be 0.11, state and justify your decision.
Reject Ho because the p-value > a.
Fail to reject Ho because the p-value
> a.
O Accept Ho because the p-value > a.
O Fail to reject Ho because the p-value < a.
O Accept Ho because the p-value < a.
O Reject Ho because the p-value < a.
Transcribed Image Text:A myopenmath.com
MyOpenMath
b Answered: 40 married couples without children are... | bartleby
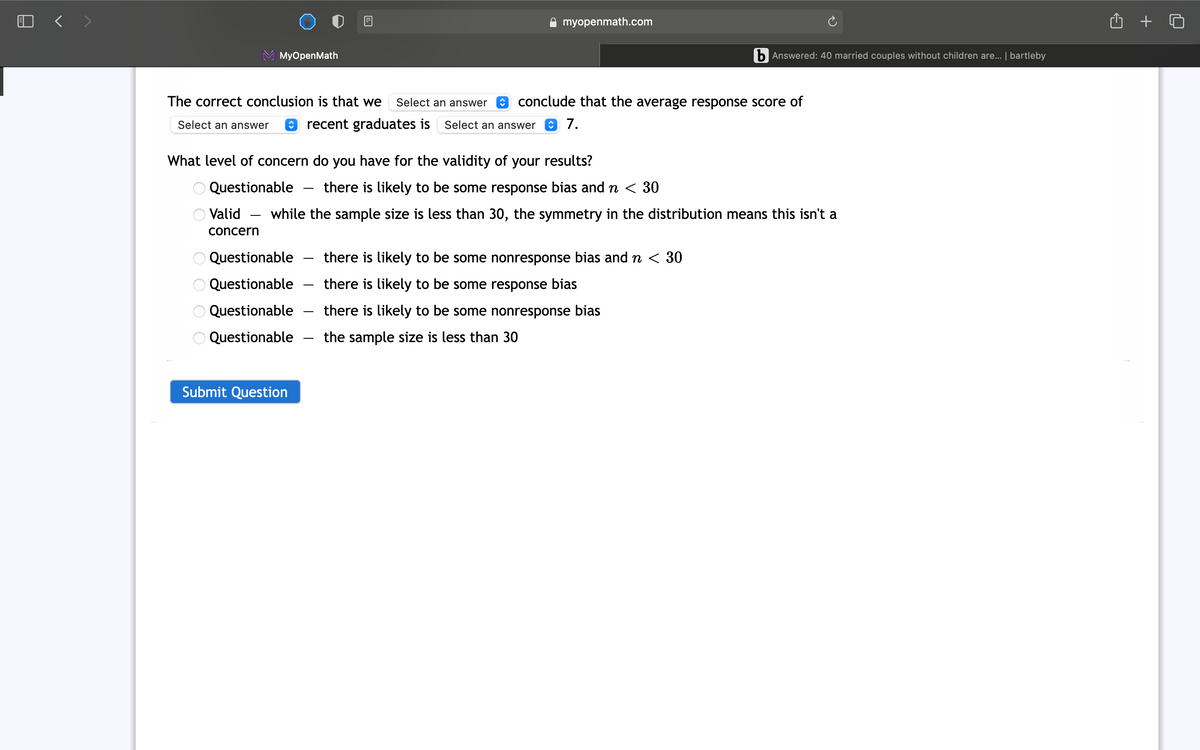
The correct conclusion is that we
Select an answer
O conclude that the average response score of
Select an answer
O recent graduates is
Select an answer
7.
What level of concern do you have for the validity of your results?
Questionable
there is likely to be some response bias and n < 30
Valid
while the sample size is less than 30, the symmetry in the distribution means this isn't a
concern
Questionable
there is likely to be some nonresponse bias and n < 30
Questionable
there is likely to be some response bias
Questionable
there is likely to be some nonresponse bias
Questionable
the sample size is less than 30
Submit Question
° 88
Expert Solution
This question has been solved!
Explore an expertly crafted, step-by-step solution for a thorough understanding of key concepts.

Step by step
Solved in 2 steps with 2 images

Knowledge Booster


Learn more about
Need a deep-dive on the concept behind this application? Look no further. Learn more about this topic, statistics and related others by exploring similar questions and additional content below.Recommended textbooks for you
Elementary Linear Algebra (MindTap Course List)
Algebra
ISBN:
9781305658004
Author:
Ron Larson
Publisher:
Cengage Learning
Elementary Linear Algebra (MindTap Course List)
Algebra
ISBN:
9781305658004
Author:
Ron Larson
Publisher:
Cengage Learning