Please create fishbone diagram for the given case, sample in is also in the photo attached.
Please create fishbone diagram for the given case, sample in is also in the photo attached.

Practical Management Science
6th Edition
ISBN:9781337406659
Author:WINSTON, Wayne L.
Publisher:WINSTON, Wayne L.
Chapter2: Introduction To Spreadsheet Modeling
Section: Chapter Questions
Problem 20P: Julie James is opening a lemonade stand. She believes the fixed cost per week of running the stand...

Related questions
Question
Please create fishbone diagram for the given case, sample in is also in the photo attached.
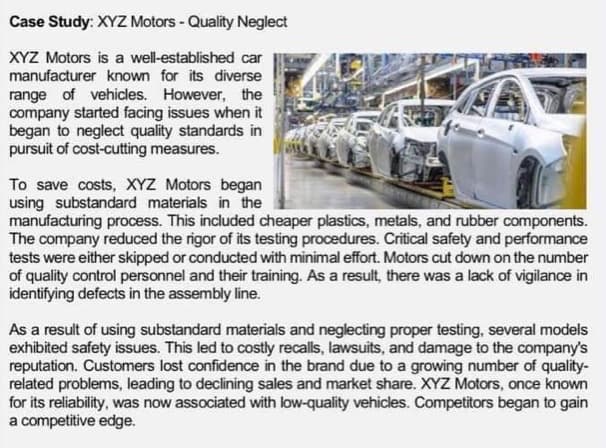
Transcribed Image Text:Case Study: XYZ Motors - Quality Neglect
XYZ Motors is a well-established car
manufacturer known for its diverse
range of vehicles. However, the
company started facing issues when it
began to neglect quality standards in
pursuit of cost-cutting measures.
To save costs, XYZ Motors began
using substandard materials in the
manufacturing process. This included cheaper plastics, metals, and rubber components.
The company reduced the rigor of its testing procedures. Critical safety and performance
tests were either skipped or conducted with minimal effort. Motors cut down on the number
of quality control personnel and their training. As a result, there was a lack of vigilance in
identifying defects in the assembly line.
As a result of using substandard materials and neglecting proper testing, several models
exhibited safety issues. This led to costly recalls, lawsuits, and damage to the company's
reputation. Customers lost confidence in the brand due to a growing number of quality-
related problems, leading to declining sales and market share. XYZ Motors, once known
for its reliability, was now associated with low-quality vehicles. Competitors began to gain
a competitive edge.
Transcribed Image Text:7:38:
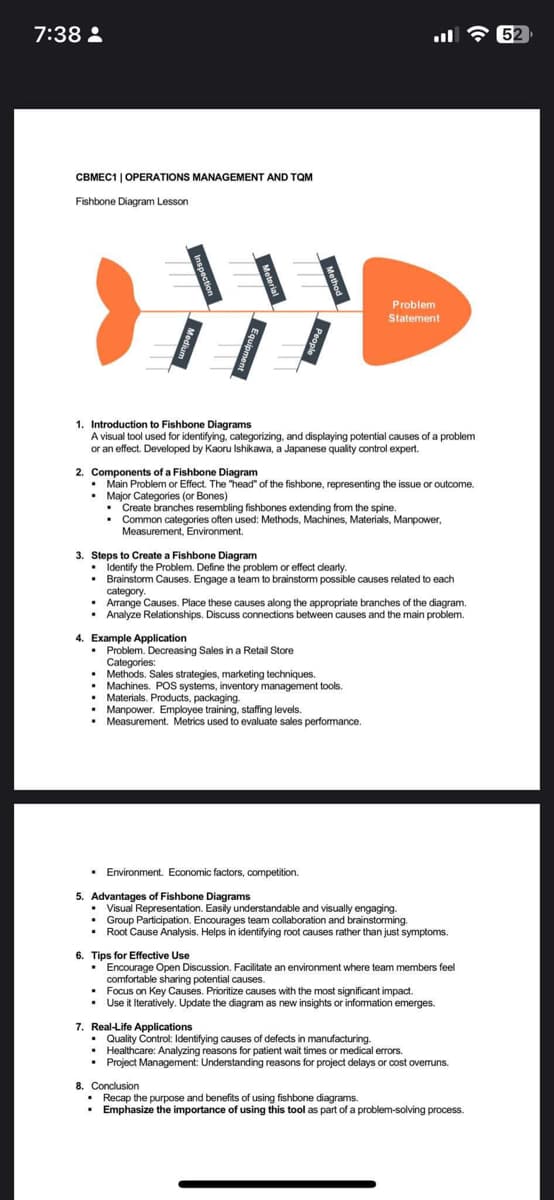
CBMEC1 | OPERATIONS MANAGEMENT AND TQM
Fishbone Diagram Lesson
WW
1. Introduction to Fishbone Diagrams
A visual tool used for identifying, categorizing, and displaying potential causes of a problem
or an effect. Developed by Kaoru Ishikawa, a Japanese quality control expert.
:
2. Components of a Fishbone Diagram
• Main Problem or Effect. The "head" of the fishbone, representing the issue or outcome.
. Major Categories (or Bones)
• Create branches resembling fishbones extending from the spine.
. Common categories often used: Methods, Machines, Materials, Manpower,
Measurement, Environment.
Problem
Statement
3. Steps to Create a Fishbone Diagram
• Identify the Problem. Define the problem or effect clearly.
. Brainstorm Causes. Engage a team to brainstorm possible causes related to each
category.
4. Example Application
• Problem. Decreasing Sales in a Retail Store
Categories:
•
Arrange Causes. Place these causes along the appropriate branches of the diagram.
• Analyze Relationships. Discuss connections between causes and the main problem.
. Methods. Sales strategies, marketing techniques.
• Machines. POS systems, inventory management tools.
Materials. Products, packaging.
• Manpower. Employee training, staffing levels.
.
Measurement. Metrics used to evaluate sales performance.
. Environment. Economic factors, competition.
5. Advantages of Fishbone Diagrams
• Visual Representation. Easily understandable and visually engaging.
• Group Participation. Encourages team collaboration and brainstorming.
. Root Cause Analysis. Helps in identifying root causes rather than just symptoms.
6. Tips for Effective Use
• Encourage Open Discussion. Facilitate an environment where team members feel
comfortable sharing potential causes.
• Focus on Key Causes. Prioritize causes with the most significant impact.
• Use it Iteratively. Update the diagram as new insights or information emerges.
7. Real-Life Applications
. Quality Control: Identifying causes of defects in manufacturing.
• Healthcare: Analyzing reasons for patient wait times or medical errors.
• Project Management: Understanding reasons for project delays or cost overruns.
8. Conclusion
• Recap the purpose and benefits of using fishbone diagrams.
• Emphasize the importance of using this tool as part of a problem-solving process.
52
Expert Solution
This question has been solved!
Explore an expertly crafted, step-by-step solution for a thorough understanding of key concepts.

Step by step
Solved in 3 steps with 1 images

Recommended textbooks for you
Practical Management Science
Operations Management
ISBN:
9781337406659
Author:
WINSTON, Wayne L.
Publisher:
Cengage,

Operations Management
Operations Management
ISBN:
9781259667473
Author:
William J Stevenson
Publisher:
McGraw-Hill Education

Operations and Supply Chain Management (Mcgraw-hi…
Operations Management
ISBN:
9781259666100
Author:
F. Robert Jacobs, Richard B Chase
Publisher:
McGraw-Hill Education
Practical Management Science
Operations Management
ISBN:
9781337406659
Author:
WINSTON, Wayne L.
Publisher:
Cengage,
Operations Management
Operations Management
ISBN:
9781259667473
Author:
William J Stevenson
Publisher:
McGraw-Hill Education
Operations and Supply Chain Management (Mcgraw-hi…
Operations Management
ISBN:
9781259666100
Author:
F. Robert Jacobs, Richard B Chase
Publisher:
McGraw-Hill Education


Purchasing and Supply Chain Management
Operations Management
ISBN:
9781285869681
Author:
Robert M. Monczka, Robert B. Handfield, Larry C. Giunipero, James L. Patterson
Publisher:
Cengage Learning

Production and Operations Analysis, Seventh Editi…
Operations Management
ISBN:
9781478623069
Author:
Steven Nahmias, Tava Lennon Olsen
Publisher:
Waveland Press, Inc.