Please do a, b, c and d. if you cant do all of them, please do: a and b. thank you

Holt Mcdougal Larson Pre-algebra: Student Edition 2012
1st Edition
ISBN:9780547587776
Author:HOLT MCDOUGAL
Publisher:HOLT MCDOUGAL
Chapter11: Data Analysis And Probability
Section: Chapter Questions
Problem 8CR

Related questions
Question
Please do a, b, c and d.
if you cant do all of them, please do: a and b.
thank you
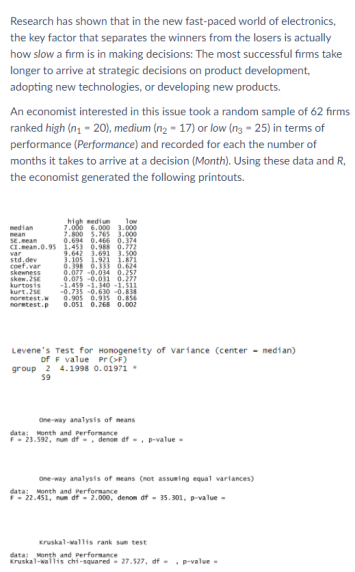
Transcribed Image Text:Research has shown that in the new fast-paced world of electronics,
the key factor that separates the winners from the losers is actually
how slow a firm is in making decisions: The most successful firms take
longer to arrive at strategic decisions on product development,
adopting new technologies, or developing new products.
An economist interested in this issue took a random sample of 62 firms
ranked high (ng - 20), medium (n2 - 17) or low (n3 - 25) in terms of
performance (Performance) and recorded for each the number of
months it takes to arrive at a decision (Month). Using these data and R,
the economist generated the following printouts.
high medium. lov
2.000 .000 1-000
2.800 5.765 3.000
0.694 0.466 0.374
CL.nean.0.95 1.453 0.98 0.772
9.642 3.691 3.s00
3.105 1.921 i.871
0.398 0.333 0.624
0.077 -0.034 0.257
0.075 -0.031 0.27
-1.459 -1. 340 -1.511
-0.735 -0.630 -0.8
0.905 0.935 0.854
noretest.p 0.05i 0.26S 0.002
median
mean
SE.ean
var
std,dev
coef.var
skewness
skew. 25E
kurtosis
kurt.25E
noretest.w
Levene's Test for Honogeneity of variance (center - median)
of F value Pr (>F)
group 2 4.1998 0.01971
59
One-way analysis of means
data: Month and Performance
F- 23.592, num af -, denon df - . p-value -
one-way analysis of neans (not assuming equal variances)
data: Month and performance
- 22.451, num df - 2.000, denom df - 35.301, p-value -
Kruskal-wallis rank sum test
data; Month and Performance
Kruskal-wallis chi-squared 27.527, df- . p-value-
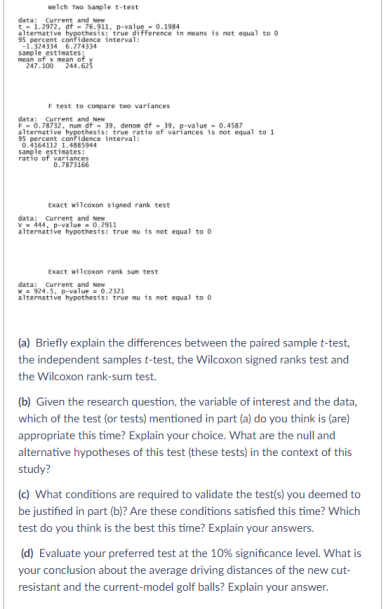
Transcribed Image Text:welch Two sample t-test
data: Current and New
t- 1.2972, of- 76.911, p-value 0.1984
alternative hypothesis: true difference in means is not equal to 0
95 percent contidence interval:
1.324334 6.274334
sanple estimates
mean of x mean of
247. 100 244.625
F test to conpare two variances
data: Current and New
-0.78732, nun df- 19, denon ef - 39. p-value- 0.4587
alternative hypothesis: true ratio of variances is not equal to 1
95 percent contidence interval:
0.4164112 1.485944
sanple estimates:
ratio of variances
0.7871166
Exact wilcoxon signed rank test
data: Current and New
V 444, P-value0,2911
alternative hypothesis: true mu is not equal to
Exact wilcoxon rank sum test
data: current and New
924.5. p-value =0.2321
alternative hypothesis: true mu is not equal to 0
(a) Briefly explain the differences between the paired sample t-test,
the independent samples t-test, the Wilcoxon signed ranks test and
the Wilcoxon rank-sum test.
(b) Given the research question, the variable of interest and the data,
which of the test (or tests) mentioned in part (a) do you think is (are)
appropriate this time? Explain your choice. What are the null and
alternative hypotheses of this test (these tests) in the context of this
study?
(c) What conditions are required to validate the test(s) you deemed to
be justified in part (b)? Are these conditions satisfied this time? Which
test do you think is the best this time? Explain your answers.
(d) Evaluate your preferred test at the 10% significance level. What is
your conclusion about the average driving distances of the new cut-
resistant and the current-model golf balls? Explain your answer.
Expert Solution
Step 1
Since you have posted a question with multiple sub-parts, we will solve first three sub-
parts for you. To get remaining sub-part solved please repost the complete question and
mention the sub-parts to be solved.
Non parametric tests do not make assumptions about the parent population of samples. Parametric test make assumptions about the parameter.

Step by step
Solved in 2 steps

Knowledge Booster


Learn more about
Need a deep-dive on the concept behind this application? Look no further. Learn more about this topic, statistics and related others by exploring similar questions and additional content below.Recommended textbooks for you
Holt Mcdougal Larson Pre-algebra: Student Edition…
Algebra
ISBN:
9780547587776
Author:
HOLT MCDOUGAL
Publisher:
HOLT MCDOUGAL

Algebra & Trigonometry with Analytic Geometry
Algebra
ISBN:
9781133382119
Author:
Swokowski
Publisher:
Cengage

College Algebra
Algebra
ISBN:
9781305115545
Author:
James Stewart, Lothar Redlin, Saleem Watson
Publisher:
Cengage Learning
Holt Mcdougal Larson Pre-algebra: Student Edition…
Algebra
ISBN:
9780547587776
Author:
HOLT MCDOUGAL
Publisher:
HOLT MCDOUGAL
Algebra & Trigonometry with Analytic Geometry
Algebra
ISBN:
9781133382119
Author:
Swokowski
Publisher:
Cengage
College Algebra
Algebra
ISBN:
9781305115545
Author:
James Stewart, Lothar Redlin, Saleem Watson
Publisher:
Cengage Learning