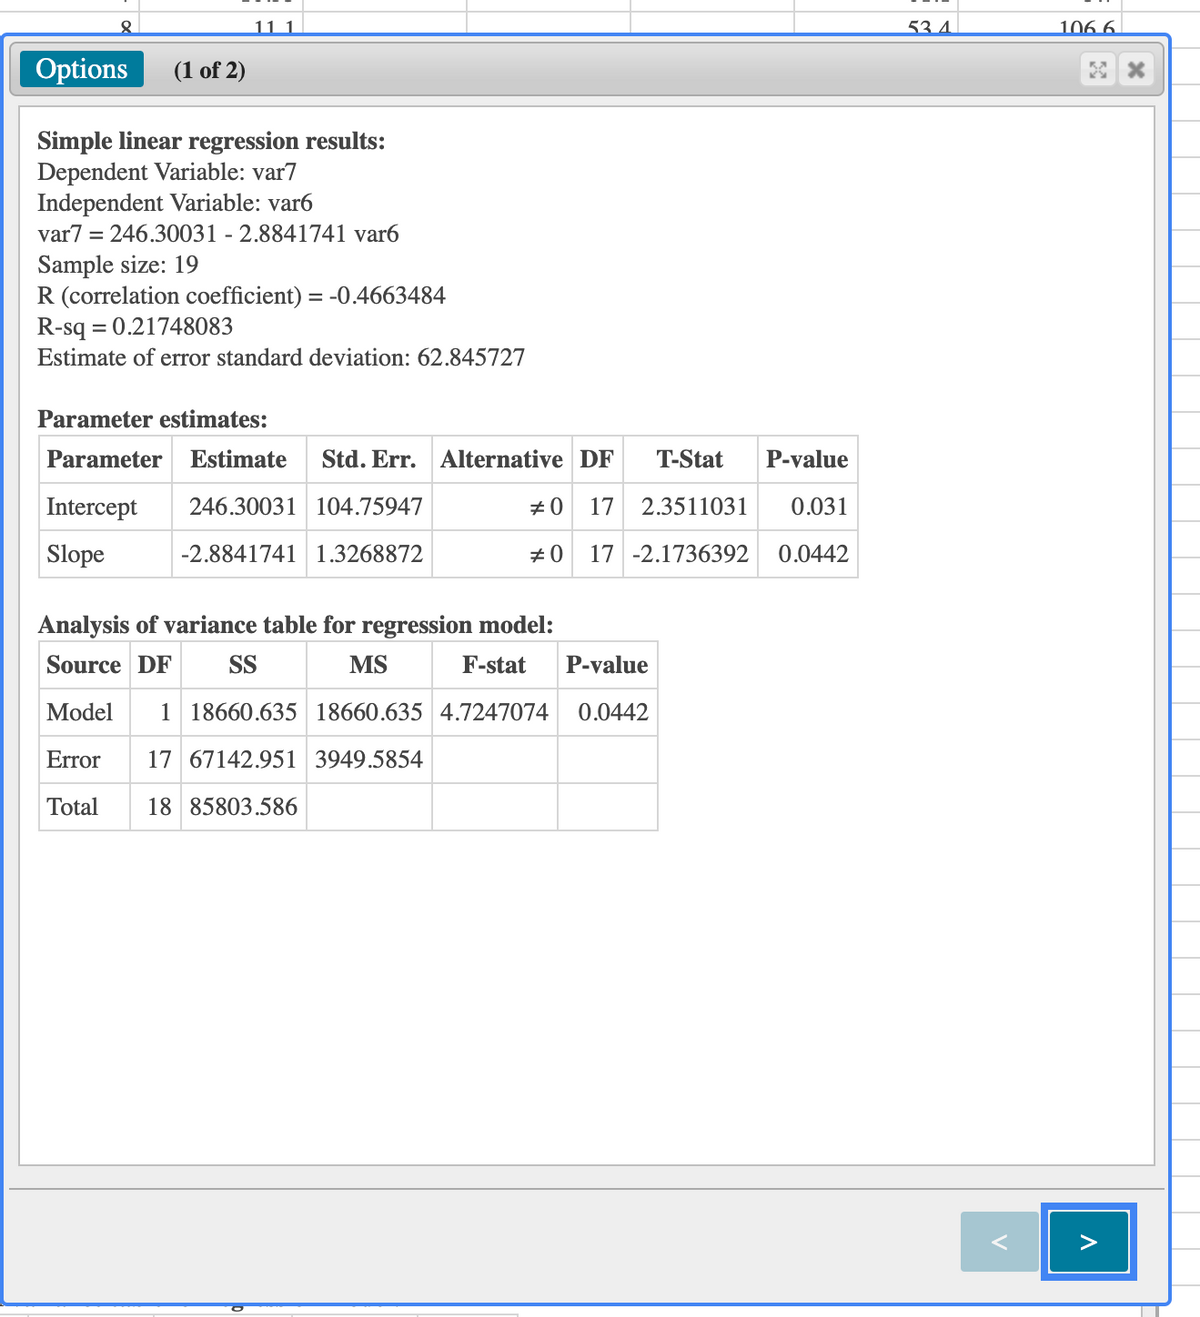
Please explain this problem. I've tried using StatCrunch (shown in the second image) but I don't understand how to retrieve the answer from all the numbers given via S
Please explain this problem. I've tried using StatCrunch (shown in the second image) but I don't understand how to retrieve the answer from all the numbers given via S

Chapter4: Linear Functions
Section: Chapter Questions
Problem 30PT: For the following exercises, use Table 4 which shows the percent of unemployed persons 25 years or...

Related questions

Question
Please explain this problem. I've tried using StatCrunch (shown in the second image) but I don't understand how to retrieve the answer from all the numbers given via StatCrunch.
Transcribed Image Text:11 1
53.4.
106.6.
Options
(1 of 2)
Simple linear regression results:
Dependent Variable: var7
Independent Variable: var6
var7 = 246.30031 - 2.8841741 var6
Sample size: 19
R (correlation coefficient) = -0.4663484
R-sq = 0.21748083
Estimate of error standard deviation: 62.845727
Parameter estimates:
Parameter
Estimate
Std. Err. Alternative DF
T-Stat
P-value
Intercept
246.30031 104.75947
#0
17
2.3511031
0.031
Slope
-2.8841741 1.3268872
#0
17 -2.1736392
0.0442
Analysis of variance table for regression model:
Source DF
SS
MS
F-stat
P-value
Model
1 18660.635 18660.635 4.7247074
0.0442
Error
17 67142.951 3949.5854
Total
18 85803.586
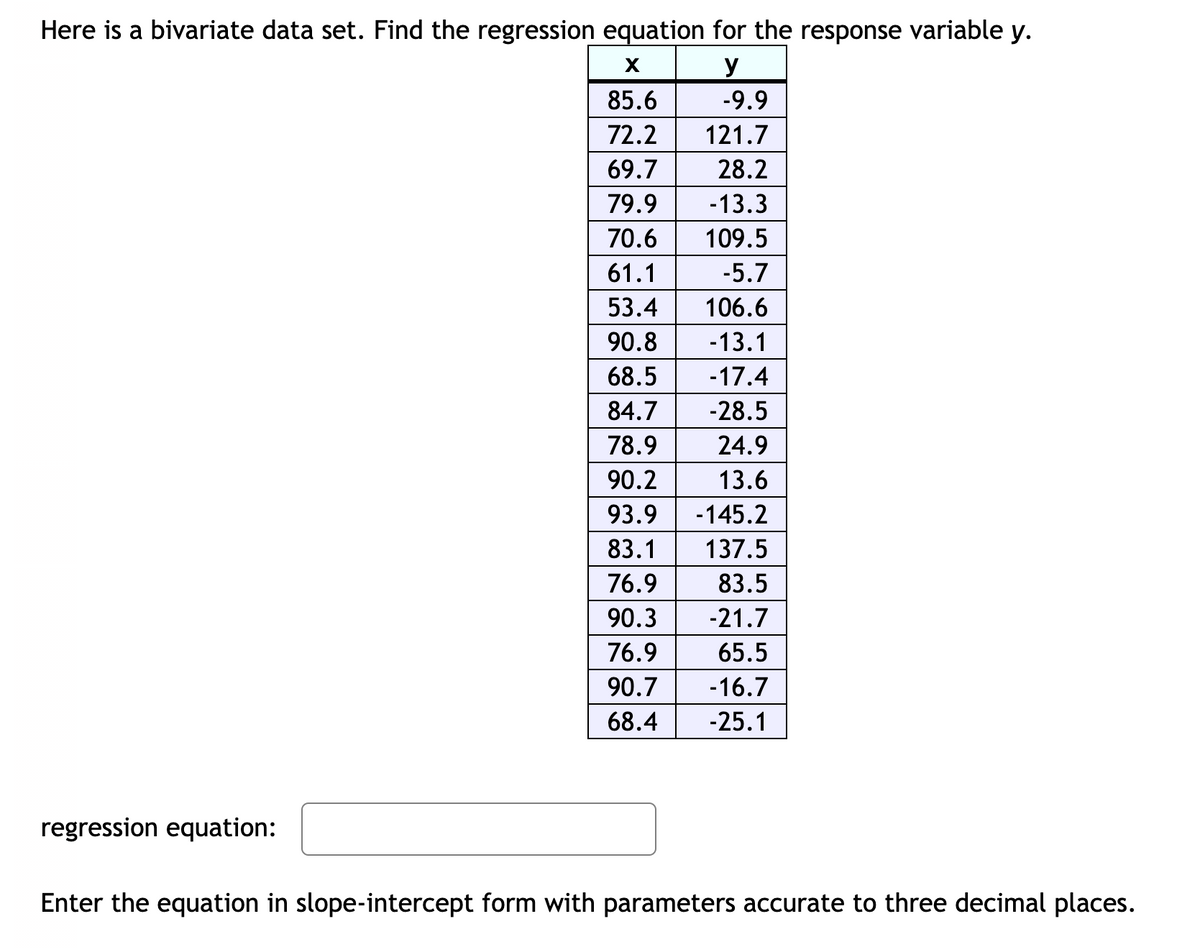
Transcribed Image Text:Here is a bivariate data set. Find the regression equation for the response variable y.
y
85.6
-9.9
72.2
121.7
69.7
28.2
79.9
-13.3
70.6
109.5
61.1
-5.7
53.4
106.6
90.8
-13.1
68.5
-17.4
84.7
-28.5
78.9
24.9
90.2
13.6
93.9
-145.2
83.1
137.5
76.9
83.5
90.3
-21.7
76.9
65.5
90.7
-16.7
68.4
-25.1
regression equation:
Enter the equation in slope-intercept form with parameters accurate to three decimal places.
Expert Solution
This question has been solved!
Explore an expertly crafted, step-by-step solution for a thorough understanding of key concepts.

Step by step
Solved in 2 steps with 1 images

Knowledge Booster


Learn more about
Need a deep-dive on the concept behind this application? Look no further. Learn more about this topic, statistics and related others by exploring similar questions and additional content below.Recommended textbooks for you

Glencoe Algebra 1, Student Edition, 9780079039897…
Algebra
ISBN:
9780079039897
Author:
Carter
Publisher:
McGraw Hill

Functions and Change: A Modeling Approach to Coll…
Algebra
ISBN:
9781337111348
Author:
Bruce Crauder, Benny Evans, Alan Noell
Publisher:
Cengage Learning
Glencoe Algebra 1, Student Edition, 9780079039897…
Algebra
ISBN:
9780079039897
Author:
Carter
Publisher:
McGraw Hill
Functions and Change: A Modeling Approach to Coll…
Algebra
ISBN:
9781337111348
Author:
Bruce Crauder, Benny Evans, Alan Noell
Publisher:
Cengage Learning

College Algebra
Algebra
ISBN:
9781305115545
Author:
James Stewart, Lothar Redlin, Saleem Watson
Publisher:
Cengage Learning