Please graph NEATLY and ACCURATELY the equations represented by the small model above, employing an x-axis ranging from 0 to 20. The y-axis should also have a zero origin. Use appropriate scaling, place data points accurately, label axes, give title, etc. 2.Are the lines implied by the equations you’re graphing parallel with each other? What brings you to this conclusion (other than how the
Please graph NEATLY and ACCURATELY the equations represented by the small model above, employing an x-axis ranging from 0 to 20. The y-axis should also have a zero origin. Use appropriate scaling, place data points accurately, label axes, give title, etc. 2.Are the lines implied by the equations you’re graphing parallel with each other? What brings you to this conclusion (other than how the

Algebra & Trigonometry with Analytic Geometry
13th Edition
ISBN:9781133382119
Author:Swokowski
Publisher:Swokowski
Chapter5: Inverse, Exponential, And Logarithmic Functions
Section5.3: The Natural Exponential Function
Problem 44E

Related questions
Question
1.Please graph NEATLY and ACCURATELY the equations represented by the small model above, employing an x-axis
2.Are the lines implied by the equations you’re graphing parallel with each other? What brings you to this conclusion (other than how the drawn lines may appear to the eye)?
Please graph and explain
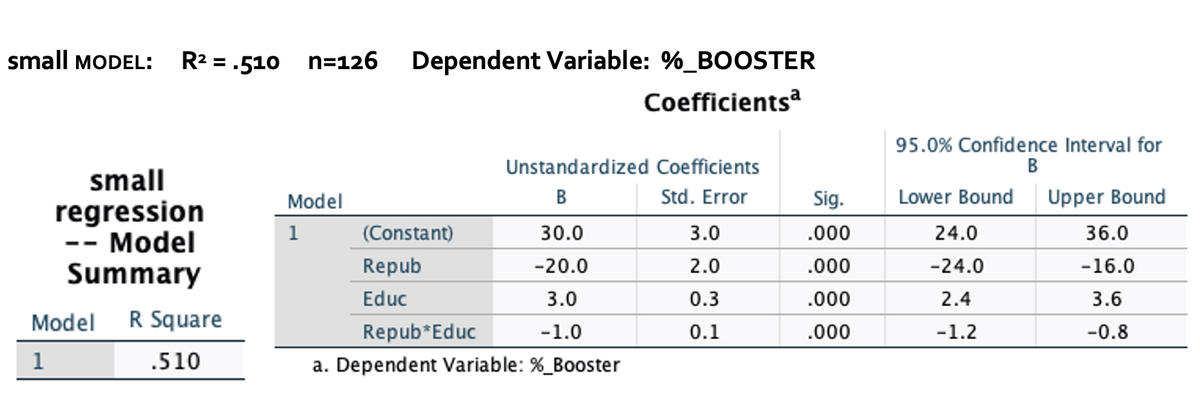
Transcribed Image Text:small MODEL:
R² = .510 n=126 Dependent Variable: %_BOOSTER
Coefficientsa
Unstandardized Coefficients
Model
B
Std. Error
1
(Constant)
30.0
3.0
Repub
-20.0
2.0
Educ
3.0
0.3
Repub*Educ
-1.0
0.1
a. Dependent Variable: %_Booster
small
regression
-- Model
Summary
Model
1
R Square
.510
Sig.
.000
.000
.000
.000
95.0% Confidence Interval for
B
Lower Bound Upper Bound
24.0
36.0
-24.0
-16.0
2.4
3.6
-1.2
-0.8
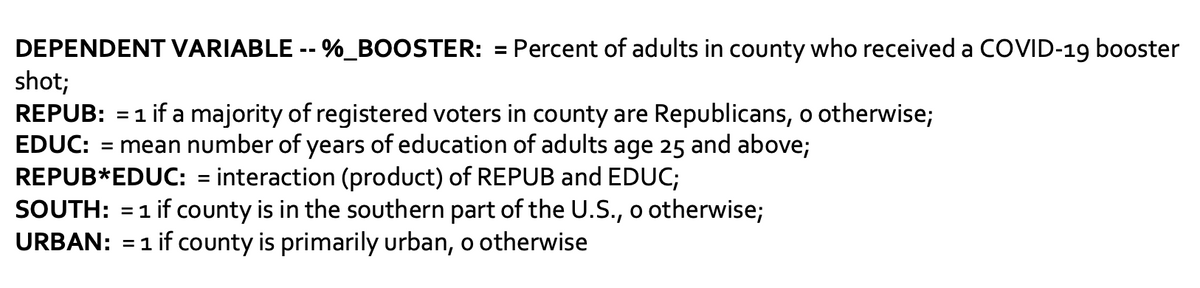
Transcribed Image Text:DEPENDENT VARIABLE -- %_BOOSTER: = Percent of adults in county who received a COVID-19 booster
shot;
REPUB: =1 if a majority of registered voters in county are Republicans, o otherwise;
EDUC: = mean number of years of education of adults age 25 and above;
REPUB*EDUC: = interaction (product) of REPUB and EDUC;
SOUTH: = 1 if county is in the southern part of the U.S., o otherwise;
URBAN: = 1 if county is primarily urban, o otherwise
Expert Solution
This question has been solved!
Explore an expertly crafted, step-by-step solution for a thorough understanding of key concepts.

Step by step
Solved in 2 steps with 2 images

Recommended textbooks for you
Algebra & Trigonometry with Analytic Geometry
Algebra
ISBN:
9781133382119
Author:
Swokowski
Publisher:
Cengage
Algebra & Trigonometry with Analytic Geometry
Algebra
ISBN:
9781133382119
Author:
Swokowski
Publisher:
Cengage