Please use the accompanying Excel data set or accompanying Text file data set when completing the following exercise. An article in Computers & Electrical Engineering, "Parallel simulation of cellular neural networks" (1996, Vol. 22, pp. 61-84) considered the speed-up of cellular neural networks (CNN) for a parallel general-purpose computing architecture based on six transputers in different areas. The data follow: 3.775302 3.350679 4.217981 4.030324 4.639692 4.139665 4.395575 4.824257 4.268119 4.584193 4.930027 4.315973 4.600101 Round your answers to 3 decimal places. Assume population is approximately normally distributed. (b) Construct a 99.9% two-sided confidence interval on the mean speed-up. <
Q: different lakes, researchers classified the primary food choice (in volume) found in the alligator's…
A: This type of bar graph, with categories listed in order of frequency, has its special name as…
Q: A construction company includes 15 engineers, 4 accountants and 5 information technology managers. A…
A: Given information: Number of engineers in the company = 15 Number of accountants in the company = 4…
Q: Describe the who in the world of the study choose the correct answer below
A: Given: A research center conducts an extensive survey consisting of an interview and medical…
Q: For a Normal distribution with mean 0 and standard deviation 1, which of the following Python lines…
A: Here Given, Normal distribution with mean zero and standard deviation 1. z-score = 0.325
Q: Let X be a random variable with the probability distribution below. Find Hg(x) where g(x) = (2x +…
A:
Q: The weekly demand for propane gas (in 1000s of gallons) from a particular facility is an rv X with…
A:
Q: QUESTION 4 For the following, classify them as quantitative or qualitative. If the variable is…
A: Qualitative data: The data consists of only the categorical data is considered to be qualitative…
Q: f an asset declines in value from 5,000 USD to 3,500 USD over nine years, what is the mean annual…
A: Given: Future value (F)=3500Present value (P)=5000number of years (n)=9i = the interest rate
Q: A large scale study conducted over a one year period has shown that break-ins at home occur about 6%…
A:
Q: What type of sample is this?
A: Here given, To select 10 students our of the class of 40 students, 40 names are placed in a hat and…
Q: 6. A programming team has 14 members. a) How many ways can a group of seven be chosen to work on a…
A: We have given that Total number of members = 14 Here we will use the concept of combination to find…
Q: The world series in baseball continues until either the American League team or the National League…
A: The world series in baseball continues until either the American League team or the National League…
Q: For a Gaussian random variable with = 0 and ₁=1, what is P(| X > 2) and P[X>2]?
A:
Q: ease in product price the demand for labor, resulting in wages and employment. (Enter one word in…
A: Inflation is a measure of the rate of price increase in an economy for a basket of selected products…
Q: A baseball prospect has hit in 25 out of his first 77 at-bats. Compute a 88% confidence interval for…
A: We have given that x = 25 n = 77 The sample proportion isp̂ = x/n = 25/77 = 0.3247 Confidence level…
Q: The asset turnover ratio (ATR) is the ratio of a company's revenues to the value of its assets…
A: The formula of CV is,
Q: A news program reports that 41% of the population are in favor of a certain issue, 47% are against…
A: Given 41% in favour 47% are against Rest are undecided Undecided = 100 - (47+41)=12% One person…
Q: The assets (in billions of dollars) of the four wealthiest people in a particular country are 30,…
A: For the given data Find all the required blanks
Q: 3. A researcher is interested to see if driving efficacy self-ratings are related to unsat driving…
A: Given: n = 9 Formula Used: r = n∑XY-∑X∑Yn∑X2-∑X2n∑Y2-∑Y2
Q: A national poll wants to determine what percent of all Americans favor a change in delivery to…
A: Given: A national poll wants to determine what percent of all Americans favor a change in delivery…
Q: data freq 24 1 25 3 26 2 27 4 28 10 Find the following measures of central tendency. mean = median…
A:
Q: Is the height (in inches) of students in this class a discrete or continuous variable?
A: Here height of students in the class is a continuous variable.
Q: For a Student's t-distribution with mean O, standard deviation 1, and degrees of freedom 30, which…
A: Given that mean is 0 and Standard deviation is 1. D.f. = 30 We've to find the probability that…
Q: * In building materials laboratory, it has been observed that a failure proportion of concrete cubes…
A: Let X denotes the number of cubes fail in the test. Given that n = 300, p = failure proportion =…
Q: elow are the number of cars processed each hour last week. Monday 60, 60, 71, 75, 99, 73, 74, 60,…
A:
Q: Determine whether the sampling method is random, simple random, or neither. a) In a group of 100…
A: Hint: The random sample is the sample where sample units are selected randomly. A simple random…
Q: The accompanying data represent the pulse rates (beats per minute) of nine students. Treat the…
A: We have given that, The data set is, Students (xi) pulse or frequency (fi) 1 77 2 60 3…
Q: The following data represent the results from the specific gravity (S.G.) test performed in a soil…
A: Here we have to find the greater than cumulative frequency distribution table. Please find the…
Q: An article in Computers & Electrical Engineering, "Parallel simulation of cellular neural networks"…
A: Given data: 3.775302, 3.350679, 4.217981, 4.030324, 4.639692, 4.139665, 4.395575, 4.824257,…
Q: A study is done to evaluate an exercise program for junior high school students. A physical skills…
A: Dependent sample t test: That is, the each sample unit of the data is being tested before and…
Q: Employment data at a large company reveal that 77% of the workers are married, 39% are college…
A:
Q: In February 2013, Sports Illustrated published a controversial article stating that football…
A: As per our company guidelines we are supposed to answer only first question. Kindly repost other…
Q: A researcher wants to estimate the proportion Americans that favor a change in delivery to reduce…
A: Given: A researcher wants to estimate the proportion Americans that favor a change in delivery to…
Q: A manufacturer must test that his bolts are 4.00 cm long when they come off the assembly line. He…
A: Given data: Population mean, μ=4 Sample size, n=121 Sample mean, x¯=4.21 Significance level, α=0.02…
Q: Ethan and Drew went on a 10-day fishing trip. The number of smallmouth bass caught and released by…
A: Given information: Ethan 10 24 7 9 5 8 9 10 8 10 Drew 15 2 3 18 20 1 17 2 19 3 Note: As per…
Q: Q4/ The average on a statistics test was 78 with a standard deviation of 8. If the test scores are…
A:
Q: Q.6: A process X(t) with Cxx (t, t+t) = E(X² (t)) - cos(T). We have E(X(t)) = A) +1 B) 1 C)+2 D) 3…
A: We have E(X2(t)) = cos(T) By the definition of variance, we have that Var(X(t)) = E(X2(t)) -…
Q: Food services sent a survey to student, faculty, and staff in order to understand the lunch…
A: Given that, Food services sent a survey to student, faculty, and staff in order to understand the…
Q: A manufacturer must test that his bolts are 4.00 cm long when they come off the assembly line. He…
A: Given that Sample size = n = 121 , Sample mean = 4.21 Population Standard Deviation = 0.83…
Q: The figure below shows relative frequency histogram for 50 employees working in a small construction…
A: Given :
Q: Scenario: A guidance counselor wanted to know if anxiety differs based on time (first day of class…
A: Given information: Problem: A guidance counselor wanted to know if anxiety differs based on time…
Q: At a border crossing, every 15th car is searched. Stratified Cluster systematic convenience none…
A: It is given that the statement about to the type of sampling. Here, need to find out the correct…
Q: A company decides to investigate the amount of sick leave taken by its employees. A sample of seven…
A: here given data :- 1,1,3,0,0,6,3 Definition of range :- range is difference between largest value…
Q: Each front tire on a particular type of vehicle is supposed to be filled to a pressure of 25 psi.…
A: The question is about joint prob. distribution Given : f ( x, y ) = K ( x2 + y2 ) ; 20 ≤ x ≤ 30,…
Q: An executive's telephone log showed the lengths of 60 calls initiated during the last week of July 1…
A: Given data indicates the length of 60 calls in an executive's telephone log.
Q: An executive's telephone log showed the lengths of 60 calls initiated during the last week of July.…
A: First we enter the given data set in excel sheet. To calculate 1st quartile in excel we use…
Q: For customers purchasing a refrigerator at a certain appliance store, let A be the event that the…
A: Given , P(A) = 0.76 P(B|A) = 0.85 P(B|A') = 0.75 P(C|A∩B) = 0.84 P(C|A∩B') = 0.61 P(C|A'∩B) = 0.69…
Q: Scenario: Researchers were interested in how social situations can influence stress-induced eating.…
A: Given information: Problem: How social situations can influence stress-induced eating. No. of…
Q: The standard deviation of test scores on a certain achievement test is 10.7. A random sample of 60…
A: It is given that a random sample of 60 scores on this test had a mean of 76.1 and the population…
Q: Hi there, I hope you're well. I have attached the results of a chi-square goodness of fit test for…
A: Given information: Sports Participation Treatment x No Sports Participation Treatment y 1 85…
ENGINEERING DATA ANALYSIS
Please help me ASAP. Rate will be given accordingly. Please write your answer n the paper. Your help is much appreciated.
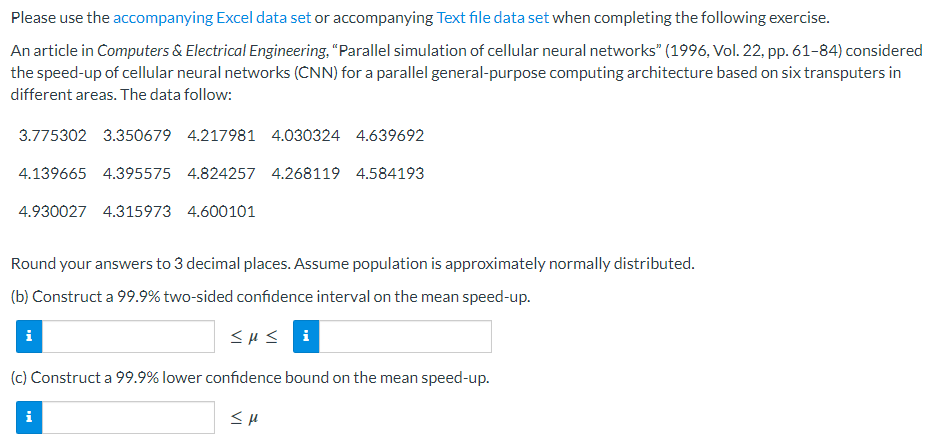
Step by step
Solved in 5 steps with 2 images
- The spike stature of the plants grown from the seeds of the porcine separates (Dactylis glomerata L) collected from the University campus and İbradı Eynif pasture are given below. In this plant, compare whether there is a difference between regions in terms of spike height. Virgo Height (cm) Data obtained from plants collected from university campus 5 6 8 7 8 6 5 5 4 6 6 Data obtained from plants collected from Eynif pasture 12 9 11 9 9 11 9 10 11 10 Note: Your results interpretation according to two different possibilities (Do it separately, assuming that it is 0.07 and 0.04).A paper investigated the driving behavior of teenagers by observing their vehicles as they left a high school parking lot and then again at a site approximately 1 2 mile from the school. Assume that it is reasonable to regard the teen drivers in this study as representative of the population of teen drivers. Amount by Which Speed Limit Was Exceeded MaleDriver FemaleDriver 1.2 -0.1 1.4 0.4 0.9 1.1 2.1 0.7 0.7 1.1 1.3 1.2 3 0.1 1.3 0.9 0.6 0.5 2.1 0.5 (a) Use a .01 level of significance for any hypothesis tests. Data consistent with summary quantities appearing in the paper are given in the table. The measurements represent the difference between the observed vehicle speed and the posted speed limit (in miles per hour) for a sample of male teenage drivers and a sample of female teenage drivers. (Use μmales − μfemales.Round your test statistic to two decimal places. Round your degrees of freedom down to the nearest whole number. Round your p-value to…A paper investigated the driving behavior of teenagers by observing their vehicles as they left a high school parking lot and then again at a site approximately 1 2 mile from the school. Assume that it is reasonable to regard the teen drivers in this study as representative of the population of teen drivers. Amount by Which Speed Limit Was Exceeded MaleDriver FemaleDriver 1.3 -0.1 1.3 0.4 0.9 1.1 2.1 0.7 0.7 1.1 1.3 1.2 3 0.1 1.3 0.9 0.6 0.5 2.1 0.5 (a) Use a .01 level of significance for any hypothesis tests. Data consistent with summary quantities appearing in the paper are given in the table. The measurements represent the difference between the observed vehicle speed and the posted speed limit (in miles per hour) for a sample of male teenage drivers and a sample of female teenage drivers. (Use μmales − μfemales.Round your test statistic to two decimal places. Round your degrees of freedom down to the nearest whole number. Round your p-value to…
- Here is a dataset containing plant growth measurements of plants grown in solutions of commonly-found chemicals in roadway runoff.Phragmites australis, a fast-growing non-native grass common to roadsides and disturbed wetlands of Tidewater Virginia, was grown in a greenhouse and watered with either: Distilled water (control); A weak petroleum solution (representing standard roadway runoff); Sodium chloride solution; Magnesium chloride solution; De-icing brine (50% sodium chloride and 50% magnesium chloride).Twenty grass preparations were used for each solution, and total growth (in cm) was recorded after watering every other day for 40 days.-Perform the correct statistical test to determine the p-value.-Report your answer rounded to four decimal places.-You should use formulas, functions, and the Data Analysis ToolPak in MS Excel to avoid additive rounding errors. Here are some useful functions: =t.test(array1,array2,tails,type) Produces a p-value for any…Consider the following data: Fit a line, y = x1 + x2t, to the data using the least squares approach.Kaitlyn measures the upload speed in megabits per second of her home broadband internet connection during peak hours and off-peak hours. The results are provided in the accompanying table. Peak Off-Peak 5.83 5.14 6.05 6.80 7.14 6.98 3.54 5.77 5.45 7.27 5.90 6.62 5.81 6.19 4.82 6.08 6.37 6.59 4.65 5.58 5.30 7.41 6.48 6.26 5.96 6.37 5.79 6.31 6.84 6.55 5.06 4.95 5.61 7.03 6.45 6.77 Examine the results of Kaitlyn's test to determine the statements that compare the medians and interquartile ranges of the data sets to each other in terms of this situation. Select the two correct answers. The median upload speed during peak hours is 5.905 megabits per second, which is less than the median upload speed during off-peak hours, 7.005 megabits per second. The upload speeds during peak hours are slower on average compared to off-peak times. The median upload speed during peak hours is 6.37 megabits per second, which is greater than the median upload speed during…
- Because of high tuition costs at state and private universities, enrollments atcommunity colleges have increased dramatically in recent years. The following data show theenrollment (in thousands) for Jefferson Community College from 2001–2009:Year Period (t) Enrollment (1000s)2001 1 6.52002 2 8.12003 3 8.42004 4 10.22005 5 12.52006 6 13.32007 7 13.72008 8 17.22009 9 18.1Compute F10: the Forecast for 2010. Compute Pearson’s Correlation Coefficient Use the Method of Least Squares to obtain the Best-Fit-Line for this data. Use the line to compute the forecast.The data given is shown below 40 40 43 46 44 49 51 54 46 51 47 49 49 45 45 44 45 41 49 52 51 54 50 51 41 52 53 50 46 56 42 42 40 42 49 47 51 48 46 57 48 55 49 46 57 44 49 43 44 43 51 48 48 46 49 Class width = 6 Find the following: A. Decile (5th) B. Quartile (2nd) C. Skewness D. Kurtosisrofessor Cornish studied rainfall cycles and sunspot cycles. (Reference: Australian Journal of Physics, Vol. 7, pp. 334-346.) Part of the data include amount of rain (in mm) for 6-day intervals. The following data give rain amounts for consecutive 6-day intervals at Adelaide, South Australia. 7 28 7 1 69 3 1 4 22 7 16 4 54 160 60 73 27 3 3 1 7 144 107 4 91 44 1 8 4 22 4 59 116 52 4 155 42 24 11 43 3 24 19 74 26 63 110 39 34 71 52 39 8 0 15 2 14 9 1 2 4 9 6 10 (i) Find the median. (Use 1 decimal place.)(ii) Convert this sequence of numbers to a sequence of symbols A and B, where A indicates a value above the median and B a value below the median. Test the sequence for randomness about the median at the 5% level of significance. (b) Find the number of runs R, n1, and n2. Let n1 = number of values above the median and n2 = number of values below the median. R n1 n2 (c) In the case, n1 > 20, we cannot use Table 10 of Appendix II to find the critical…
- The manager of the purchasing department of a large banking organization would like to develop a model to predict the amount of time it takes to process invoices. Data are collected from a sample of 30 days with the following results: Relating time to invoices processed. Day Invoices Processed Completion Time (hours) Day Invoices Processed Completion Time (hours) 1 149 2.1 16 169 2.5 2 60 1.8 17 190 2.9 3 188 2.3 18 233 3.4 4 19 0.3 19 289 4.1 5 201 2.7 20 45 1.2 6 58 1.0 21 193 2.5 7 77 1.7 22 70 1.8 8 222…The data in the attached image represents blood pressure based on a new trial medication used in an experiment involving a total of 50 male and female subjects. There were two levels of treatment: 0 = placebo and 1 = treatment group. Family History Blood Pressure = Fam-Hist-BP; from the paternal side = PS; from the maternal side = MS; from both sides = BS; none on both sides or not known = N.; Blood pressure before the experiment = BP-Before-Exp; Blood pressure after the experiment = BP-After-Exp. Task: Construct a scatterplot to display the relationship and find the correlation between age and BP-Before Exp.The data in the attached image represents blood pressure based on a new trial medication used in an experiment involving a total of 50 male and female subjects. There were two levels of treatment: 0 = placebo and 1 = treatment group. Family History Blood Pressure = Fam-Hist-BP; from the paternal side = PS; from the maternal side = MS; from both sides = BS; none on both sides or not known = N.; Blood pressure before the experiment = BP-Before-Exp; Blood pressure after the experiment = BP-After-Exp. Task: Construct a histogram to represent the family BP history, the subjects' BP before treatment and the subjects' BP after treatment.