Plot a graph temperature waves as functions of time and depth. (b) Plot on a graph the vertical soil temperature profiles at 0435, 0835, 1235, 1635, 2035, and 0035 h.   (c) Determine the damping depth and thermal diffusivity of the soil from the observed amplitudes, as well as from the times of temperature maxima (taken from the smoothed temperature waves) as functions of depth.

Applications and Investigations in Earth Science (9th Edition)
9th Edition
ISBN:9780134746241
Author:Edward J. Tarbuck, Frederick K. Lutgens, Dennis G. Tasa
Publisher:Edward J. Tarbuck, Frederick K. Lutgens, Dennis G. Tasa
Chapter1: The Study Of Minerals
Section: Chapter Questions
Problem 1LR
icon
Related questions
Question

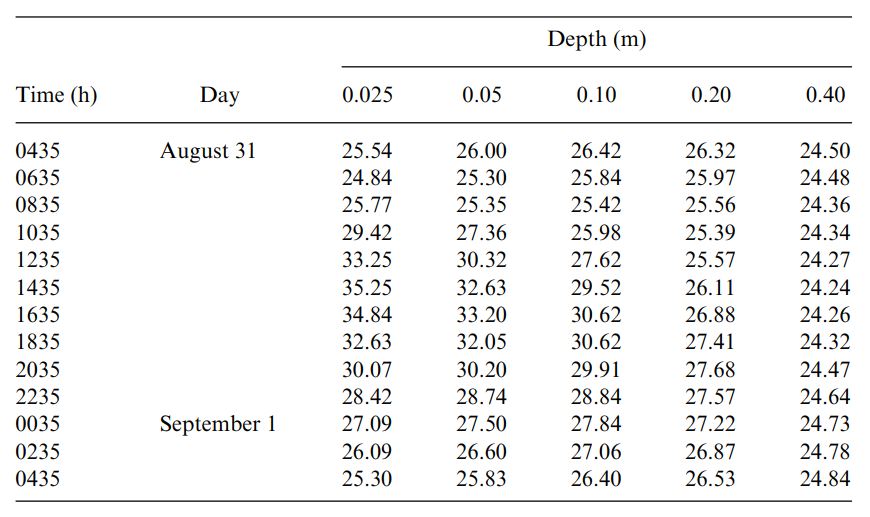
The following soil temperatures (C) were measured during the Great Plains Field Program at O'Neil, Nebraska


Table1. Data table of soil temperature measured during the Great Plains Field Program
at O'Neil, Nebraska


(a) Plot a graph temperature waves as functions of time and depth.


(b) Plot on a graph the vertical soil temperature profiles at 0435, 0835, 1235, 1635, 2035, and 0035 h.


(c) Determine the damping depth and thermal diffusivity of the soil from the observed amplitudes, as well as from
the times of temperature maxima (taken from the smoothed temperature waves) as functions of depth.


        c.1 Determination of damping depth and thermal diffusivity from the observed amplitudes:
        c.2 Determination of damping depth and thermal diffusivity based on time lag data:


(d) Estimate the amplitude of the surface temperature wave and the time of maximum surface temperature from
extrapolation of the soil temperature data.

Depth (m)
Time (h)
Day
0.025
0.05
0.10
0.20
0.40
0435
August 31
25.54
26.00
26.42
26.32
24.50
0635
24.84
25.30
25.84
25.97
24.48
0835
25.77
25.35
25.42
25.56
24.36
1035
29.42
27.36
25.98
25.39
24.34
1235
33.25
30.32
27.62
25.57
24.27
1435
35.25
32.63
29.52
26.11
24.24
1635
34.84
33.20
30.62
26.88
24.26
1835
32.63
32.05
30.62
27.41
24.32
2035
30.07
30.20
29.91
27.68
24.47
2235
28.42
28.74
28.84
27.57
24.64
0035
September 1
27.09
27.50
27.84
27.22
24.73
0235
26.09
26.60
27.06
26.87
24.78
0435
25.30
25.83
26.40
26.53
24.84
Transcribed Image Text:Depth (m) Time (h) Day 0.025 0.05 0.10 0.20 0.40 0435 August 31 25.54 26.00 26.42 26.32 24.50 0635 24.84 25.30 25.84 25.97 24.48 0835 25.77 25.35 25.42 25.56 24.36 1035 29.42 27.36 25.98 25.39 24.34 1235 33.25 30.32 27.62 25.57 24.27 1435 35.25 32.63 29.52 26.11 24.24 1635 34.84 33.20 30.62 26.88 24.26 1835 32.63 32.05 30.62 27.41 24.32 2035 30.07 30.20 29.91 27.68 24.47 2235 28.42 28.74 28.84 27.57 24.64 0035 September 1 27.09 27.50 27.84 27.22 24.73 0235 26.09 26.60 27.06 26.87 24.78 0435 25.30 25.83 26.40 26.53 24.84
Expert Solution
trending now

Trending now

This is a popular solution!

steps

Step by step

Solved in 4 steps with 2 images

Blurred answer
Recommended textbooks for you
Applications and Investigations in Earth Science …
Earth Science
ISBN:
9780134746241
Author:
Edward J. Tarbuck, Frederick K. Lutgens, Dennis G. Tasa
Publisher:
PEARSON
Exercises for Weather & Climate (9th Edition)
Earth Science
ISBN:
9780134041360
Author:
Greg Carbone
Publisher:
PEARSON
Environmental Science
Earth Science
ISBN:
9781260153125
Author:
William P Cunningham Prof., Mary Ann Cunningham Professor
Publisher:
McGraw-Hill Education
Earth Science (15th Edition)
Earth Science
ISBN:
9780134543536
Author:
Edward J. Tarbuck, Frederick K. Lutgens, Dennis G. Tasa
Publisher:
PEARSON
Environmental Science (MindTap Course List)
Earth Science
ISBN:
9781337569613
Author:
G. Tyler Miller, Scott Spoolman
Publisher:
Cengage Learning
Physical Geology
Physical Geology
Earth Science
ISBN:
9781259916823
Author:
Plummer, Charles C., CARLSON, Diane H., Hammersley, Lisa
Publisher:
Mcgraw-hill Education,