Plot data on a line graph

Chapter3: Functions
Section3.3: Rates Of Change And Behavior Of Graphs
Problem 27SE: Table 4 gives the population of a town (in thousand) from 2000 to 2008. What was the average rate of...

Related questions
Question
Plot data on a line graph
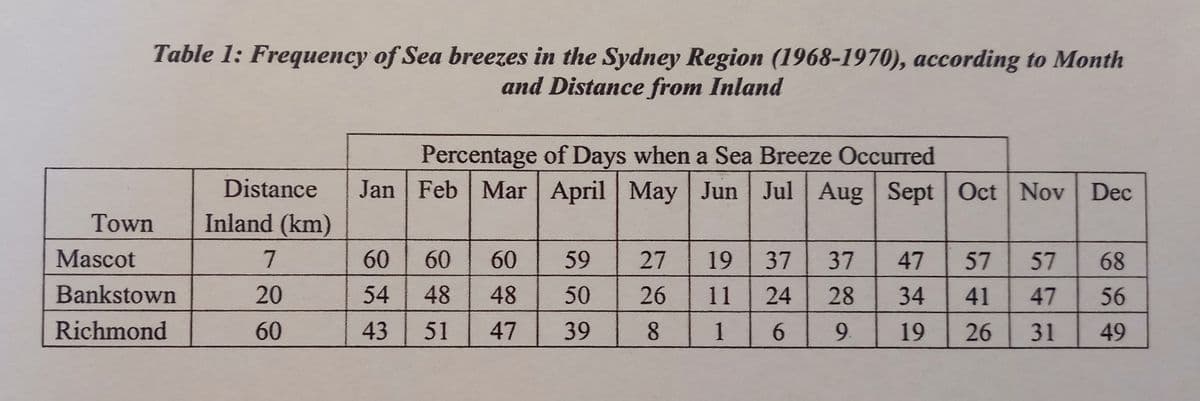
Transcribed Image Text:Table 1: Frequency of Sea breezes in the Sydney Region (1968-1970), according to Month
and Distance from Inland
Town
Mascot
Bankstown
Richmond
Percentage of Days when a Sea Breeze Occurred
Distance Jan Feb Mar April May Jun Jul Aug Sept Oct Nov Dec
|
Inland (km)
7
20
60
60
54 48
43 51
60 60
48
47
59
50
39
27
26
8
19 37 37 47 57 57 68
11
24 28
34
41
47
56
1 6
9.
19
26
31
49
Expert Solution
This question has been solved!
Explore an expertly crafted, step-by-step solution for a thorough understanding of key concepts.

Step by step
Solved in 2 steps with 2 images

Recommended textbooks for you

Glencoe Algebra 1, Student Edition, 9780079039897…
Algebra
ISBN:
9780079039897
Author:
Carter
Publisher:
McGraw Hill
Glencoe Algebra 1, Student Edition, 9780079039897…
Algebra
ISBN:
9780079039897
Author:
Carter
Publisher:
McGraw Hill