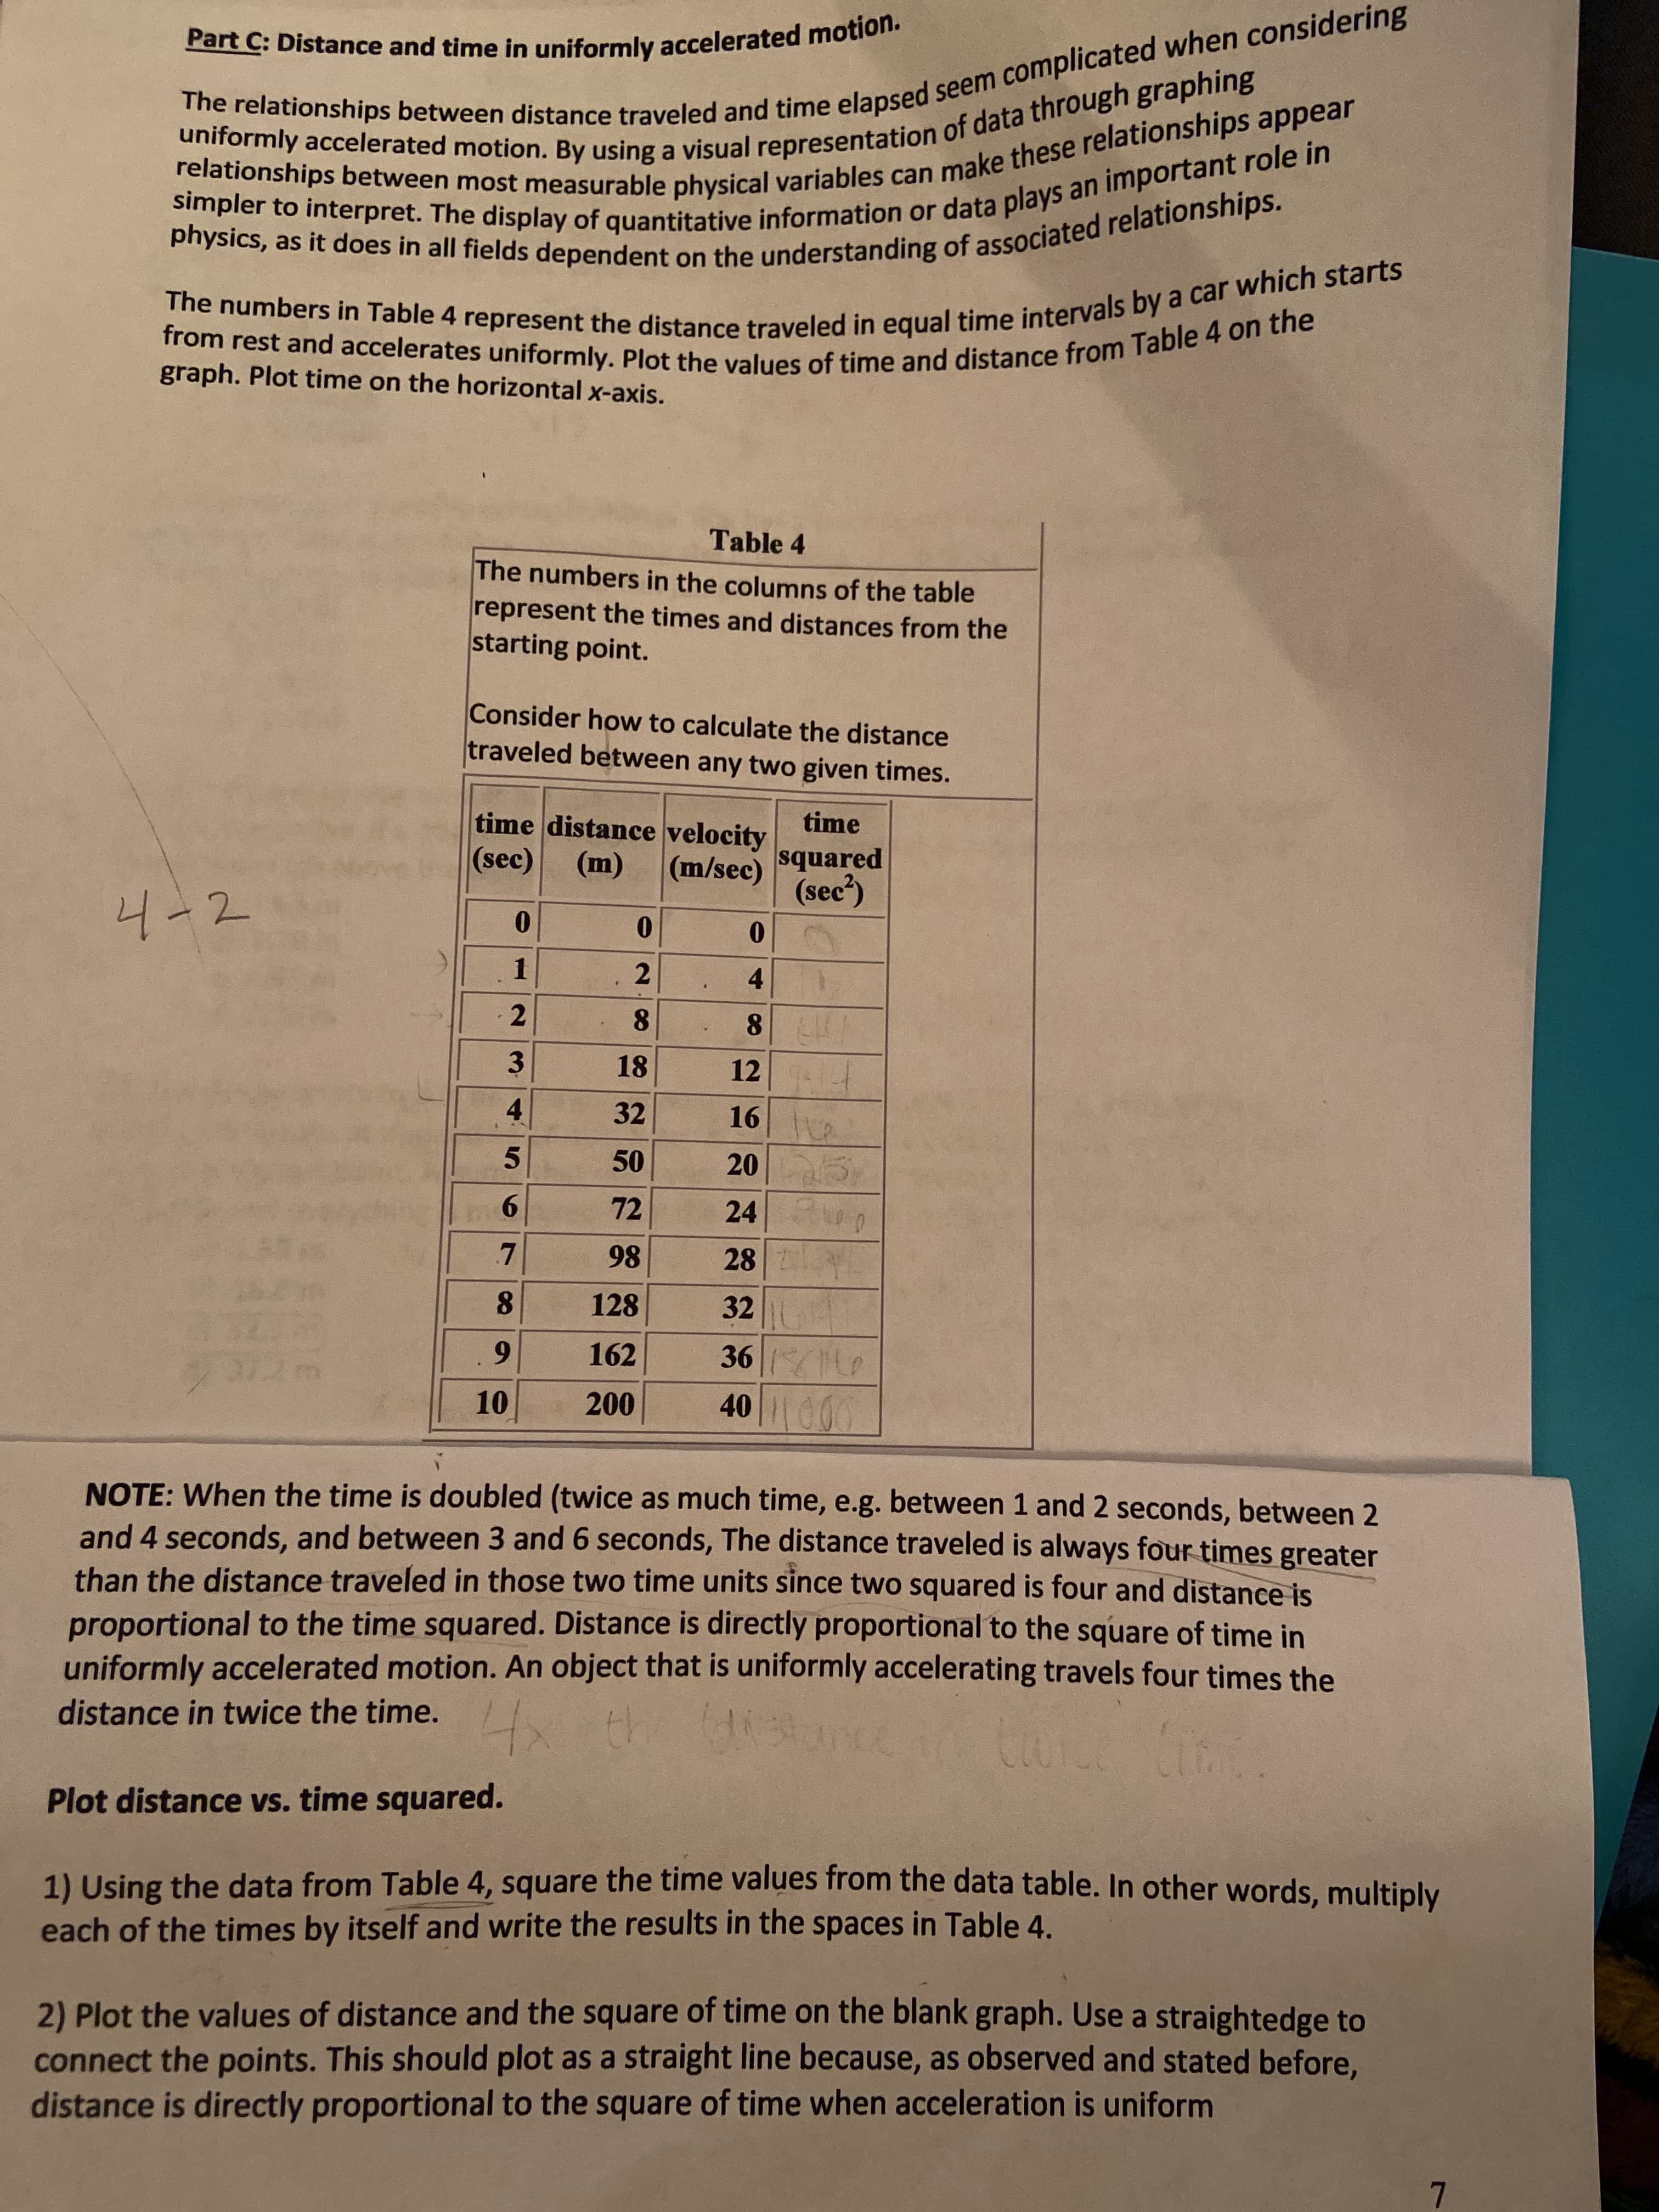
Plot distance vs. time squared. 1) Using the data from Table 4, square the time values from the data table. In other words, multiply each of the times by itself and write the results in the spaces in Table 4. 2) Plot the values of distance and the square of time on the blank graph. Use a straightedge to connect the points. This should plot as a straight line because, as observed and stated before, distance is directly proportional to the square of time when acceleration is uniform
Plot distance vs. time squared. 1) Using the data from Table 4, square the time values from the data table. In other words, multiply each of the times by itself and write the results in the spaces in Table 4. 2) Plot the values of distance and the square of time on the blank graph. Use a straightedge to connect the points. This should plot as a straight line because, as observed and stated before, distance is directly proportional to the square of time when acceleration is uniform

Chapter3: The First Law Of Thermodynamics
Section: Chapter Questions
Problem 15CQ: Is it possible for to be smaller than unity? `

Related questions

Question
I am unsure of my own answers and if I am undestanding what is asking and how to graph the points. When I was first doing the t^2 blanks I was taking the (t)^2 and using that. So my first few points were, 0, 1, 4, 9...
Transcribed Image Text:Plot distance vs. time squared.
1) Using the data from Table 4, square the time values from the data table. In other words, multiply
each of the times by itself and write the results in the spaces in Table 4.
2) Plot the values of distance and the square of time on the blank graph. Use a straightedge to
connect the points. This should plot as a straight line because, as observed and stated before,
distance is directly proportional to the square of time when acceleration is uniform

Expert Solution
This question has been solved!
Explore an expertly crafted, step-by-step solution for a thorough understanding of key concepts.

This is a popular solution!

Trending now
This is a popular solution!

Step by step
Solved in 4 steps with 4 images

Knowledge Booster


Learn more about
Need a deep-dive on the concept behind this application? Look no further. Learn more about this topic, physics and related others by exploring similar questions and additional content below.Recommended textbooks for you