Plot X & Y axis as a scatter plot and describe the plotted data. Calculation (no changes here): Does increased rainfall correlated to higher crop yield? If you were testing for significance, state the null hypothesis and alternative hypothesis you were testing for both correlation and regression. List three factors that contributes to your conclusion. Thanks
Plot X & Y axis as a scatter plot and describe the plotted data. Calculation (no changes here): Does increased rainfall correlated to higher crop yield? If you were testing for significance, state the null hypothesis and alternative hypothesis you were testing for both correlation and regression. List three factors that contributes to your conclusion. Thanks

Algebra & Trigonometry with Analytic Geometry
13th Edition
ISBN:9781133382119
Author:Swokowski
Publisher:Swokowski
Chapter7: Analytic Trigonometry
Section7.6: The Inverse Trigonometric Functions
Problem 93E

Related questions
Question
Plot X & Y axis as a scatter plot and describe the plotted data.
Calculation (no changes here):
Does increased rainfall correlated to higher crop yield? If you were testing for significance, state the null hypothesis and alternative hypothesis you were testing for both correlation and regression . List three factors that contributes to your conclusion.
Thanks
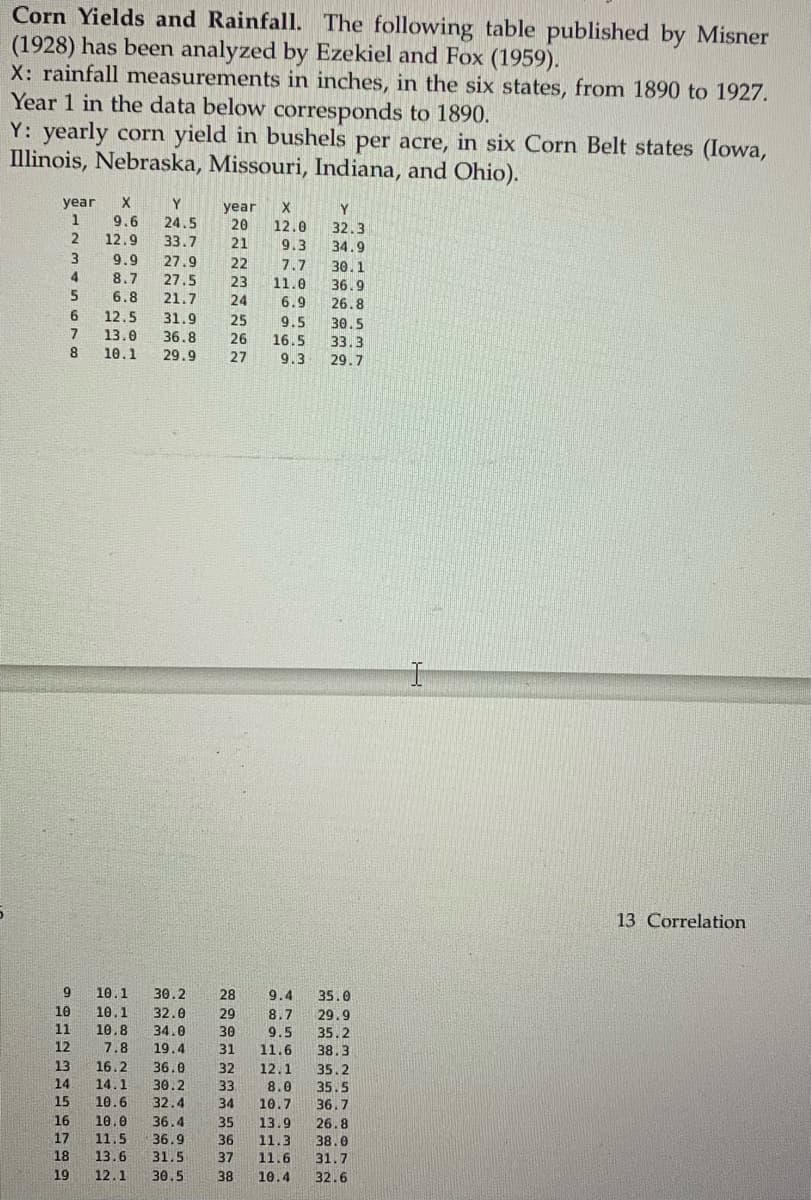
Transcribed Image Text:Corn Yields and Rainfall. The following table published by Misner
(1928) has been analyzed by Ezekiel and Fox (1959).
X: rainfall measurements in inches, in the six states, from 1890 to 1927.
Year 1 in the data below corresponds to 1890.
Y: yearly corn yield in bushels per acre, in six Corn Belt states (Iowa,
Illinois, Nebraska, Missouri, Indiana, and Ohio).
year
1
2
3
4
SAHEBHESTRA
Y
year X
24.5 20 12.0
33.7 21 9.3
27.9 22
7.7
30.1
27.5
23 11.0 36.9
5
21.7
24 6.9 26.8
25 9.5 30.5
6
12.5 31.9
7 13.0 36.8 26 16.5. 33.3
10.1 29.9
8
27 9.3 29.7
X
9.6
12.9
9 10.1 30.2 28
12
9.9
8.7
6.8
10 10.1
11 10.8
7.8
14
13 16.2
14.1
15 10.6
16 10.0
17 11.5
18 13.6
19 12.1
9.4
29 8.7
30 9.5
19.4 31 11.6
36.0
30.2
32.4
32.0
34.0
36.4
36.9
31.5
30.5
FREEMASON
32 12.1
Y
32.3
34.9
35.2
35.5
36.7
35 13.9
26.8
36 11.3
38.0
37 11.6
31.7
38 10.4 32.6
33.
8.0
34 10.7
35.0
29.9
35.2
38.3
13 Correlation
Expert Solution
This question has been solved!
Explore an expertly crafted, step-by-step solution for a thorough understanding of key concepts.

Step by step
Solved in 6 steps with 7 images

Recommended textbooks for you
Algebra & Trigonometry with Analytic Geometry
Algebra
ISBN:
9781133382119
Author:
Swokowski
Publisher:
Cengage

Functions and Change: A Modeling Approach to Coll…
Algebra
ISBN:
9781337111348
Author:
Bruce Crauder, Benny Evans, Alan Noell
Publisher:
Cengage Learning
Algebra & Trigonometry with Analytic Geometry
Algebra
ISBN:
9781133382119
Author:
Swokowski
Publisher:
Cengage
Functions and Change: A Modeling Approach to Coll…
Algebra
ISBN:
9781337111348
Author:
Bruce Crauder, Benny Evans, Alan Noell
Publisher:
Cengage Learning