Points A and B on the Combined graph represent Malaysia's and Canada's production, and the red point shows the combined production of the two countries. Which of the following is a correct interpretation of points A and B? multiple choice 1 Each country is using all of its resources. Malaysia is using a higher percentage of resources than Canada. Canada is using a higher percentage of resources than Malaysia. Both countries have unused resources that could increase production without a tradeoff.
Points A and B on the Combined graph represent Malaysia's and Canada's production, and the red point shows the combined production of the two countries. Which of the following is a correct interpretation of points A and B? multiple choice 1 Each country is using all of its resources. Malaysia is using a higher percentage of resources than Canada. Canada is using a higher percentage of resources than Malaysia. Both countries have unused resources that could increase production without a tradeoff.

Managerial Economics: Applications, Strategies and Tactics (MindTap Course List)
14th Edition
ISBN:9781305506381
Author:James R. McGuigan, R. Charles Moyer, Frederick H.deB. Harris
Publisher:James R. McGuigan, R. Charles Moyer, Frederick H.deB. Harris
Chapter5: Business And Economic Forecasting
Section: Chapter Questions
Problem 1.2CE: Plot the logarithm of arrivals for each transportation mode against time, all on the same graph....

Related questions
Question
Points A and B on the Combined graph represent Malaysia's and Canada's production, and the red point shows the combined production of the two countries.
Which of the following is a correct interpretation of points A and B?
multiple choice 1
Each country is using all of its resources.
Malaysia is using a higher percentage of resources than Canada.
Canada is using a higher percentage of resources than Malaysia.
Both countries have unused resources that could increase production without a tradeoff.
Transcribed Image Text:0
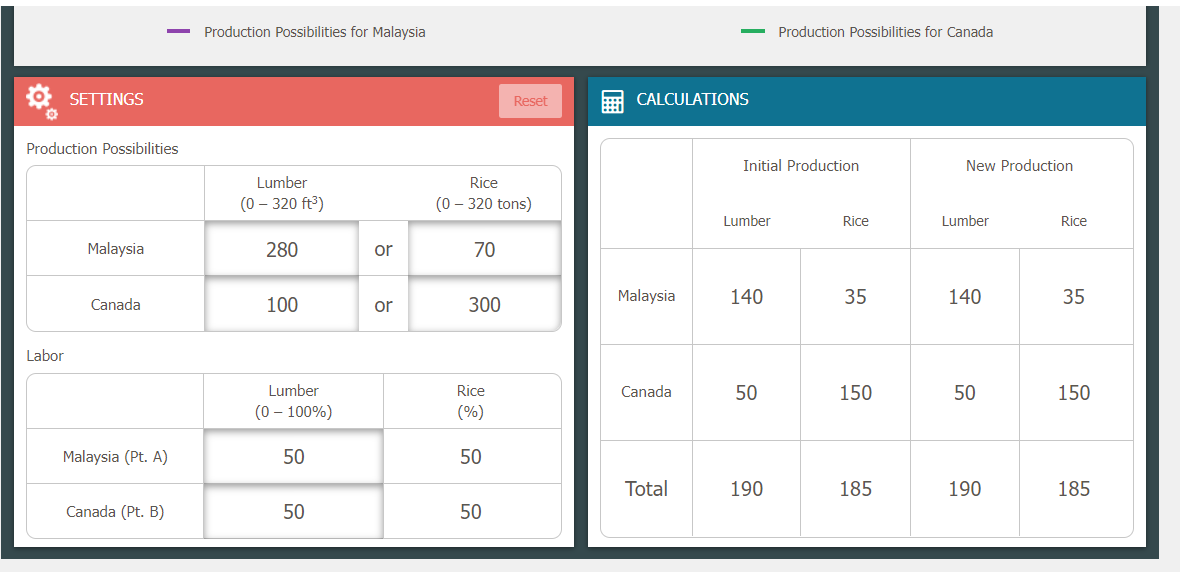
SETTINGS
Production Possibilities
Labor
Malaysia
Canada
Malaysia (Pt. A)
Canada (Pt. B)
Production Possibilities for Malaysia
Lumber
(0 - 320 ft³)
280
100
Lumber
(0 - 100%)
50
50
or
or
Rice
(0 - 320 tons)
70
300
Rice
(%)
50
Reset
50
CALCULATIONS
Malaysia
Canada
Total
Initial Production
Lumber
140
50
Production Possibilities for Canada
190
Rice
35
150
185
New Production
Lumber
140
50
190
Rice
35
150
185
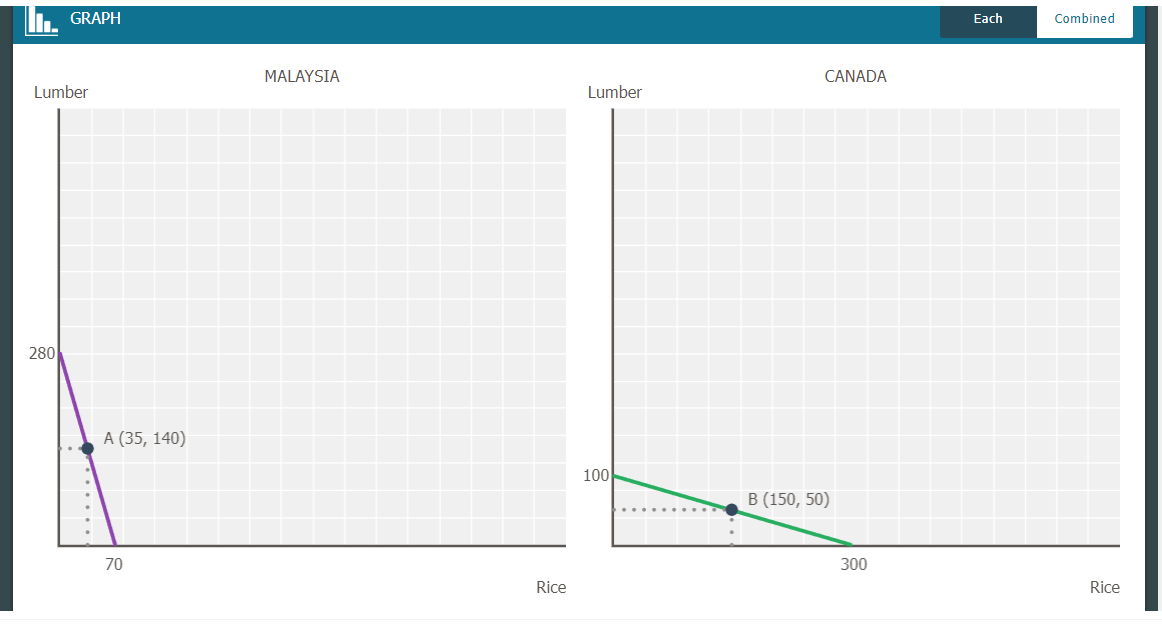
Transcribed Image Text:GRAPH
Lumber
280
A (35, 140)
70
MALAYSIA
Rice
Lumber
100
CANADA
B (150, 50)
300
Each
Combined
Rice
Expert Solution
This question has been solved!
Explore an expertly crafted, step-by-step solution for a thorough understanding of key concepts.

This is a popular solution!

Trending now
This is a popular solution!

Step by step
Solved in 3 steps

Knowledge Booster


Learn more about
Need a deep-dive on the concept behind this application? Look no further. Learn more about this topic, economics and related others by exploring similar questions and additional content below.Recommended textbooks for you
Managerial Economics: Applications, Strategies an…
Economics
ISBN:
9781305506381
Author:
James R. McGuigan, R. Charles Moyer, Frederick H.deB. Harris
Publisher:
Cengage Learning
Managerial Economics: Applications, Strategies an…
Economics
ISBN:
9781305506381
Author:
James R. McGuigan, R. Charles Moyer, Frederick H.deB. Harris
Publisher:
Cengage Learning