Polyester fiber ropes are increasingly being used as components of mooring lines for offshore structures in deep water. The authors of a paper used the accompanying data as a basis for studying how time to failure (hr) depended on load (% of breaking load): x 77.7 77.8 77.8 85.5 73.1 77.9 85.5 89.2 89.3 5.219 579.659 130.365 7.535 0.120 0.081 0.008 0.012 51.417 x 85.5 89.2 85.5 89.2 85.5 89.2 82.3 82.0 82.3 y 0.503 0.362 10.228 0.663 5.322 0.295 55.733 7.930 158.405 A linear regression of log,0(time) versus load was fit. The investigators were particularly interested in estimating the slope of the true regression line relating these variables. Investigate the quality of the fit. O A scatter plot of log10(time) versus load shows a reasonably linear pattern. O A scatter plot of log1p(time) versus load shows a curved pattem. OA scatter plot of log10(time) versus load shows a random pattern. Estimate the slope. (Round your answer to four decimal places.) Predict time to failure when load is 80, in a way that conveys information about reliability and precision. (Calculate a 95% PI. Round your answers before making any data transformations to three decimal places. Round your final answers to two decimal places.) For a rope at 80% of breaking load, we are 95% confident the failure time will be between a minimum of hours and a maximum of hours.
Polyester fiber ropes are increasingly being used as components of mooring lines for offshore structures in deep water. The authors of a paper used the accompanying data as a basis for studying how time to failure (hr) depended on load (% of breaking load): x 77.7 77.8 77.8 85.5 73.1 77.9 85.5 89.2 89.3 5.219 579.659 130.365 7.535 0.120 0.081 0.008 0.012 51.417 x 85.5 89.2 85.5 89.2 85.5 89.2 82.3 82.0 82.3 y 0.503 0.362 10.228 0.663 5.322 0.295 55.733 7.930 158.405 A linear regression of log,0(time) versus load was fit. The investigators were particularly interested in estimating the slope of the true regression line relating these variables. Investigate the quality of the fit. O A scatter plot of log10(time) versus load shows a reasonably linear pattern. O A scatter plot of log1p(time) versus load shows a curved pattem. OA scatter plot of log10(time) versus load shows a random pattern. Estimate the slope. (Round your answer to four decimal places.) Predict time to failure when load is 80, in a way that conveys information about reliability and precision. (Calculate a 95% PI. Round your answers before making any data transformations to three decimal places. Round your final answers to two decimal places.) For a rope at 80% of breaking load, we are 95% confident the failure time will be between a minimum of hours and a maximum of hours.

Glencoe Algebra 1, Student Edition, 9780079039897, 0079039898, 2018
18th Edition
ISBN:9780079039897
Author:Carter
Publisher:Carter
Chapter4: Equations Of Linear Functions
Section4.5: Correlation And Causation
Problem 2CYU

Related questions
Question
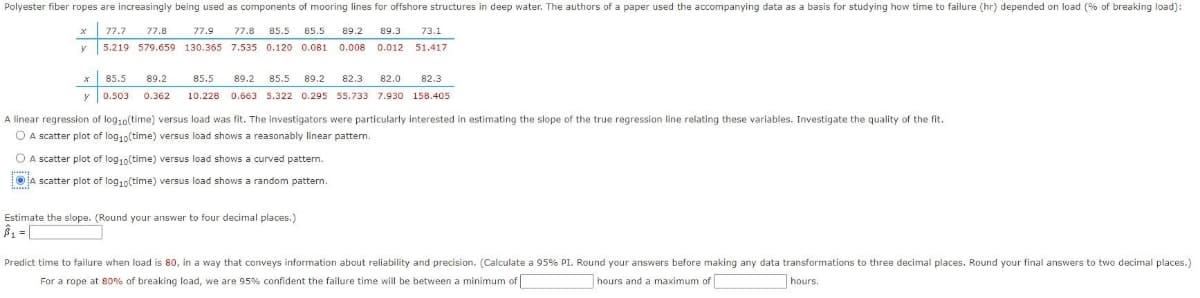
Transcribed Image Text:Polyester fiber ropes are increasingly being used as components of mooring lines for offshore structures in deep water. The authors of a paper used the accompanying data as a basis for studying how time to failure (hr) depended on load (% of breaking load):
x 77.7
77.8
77.9
77.8 85.5
85.5
89.2
89.3
73.1
5.219 579.659 130.365 7.535 0.120 0.081.
0.008 0.012
51.417
x 85.5
89.2
85.5
89.2 85.5 89.2
82.3
82.0
82.3
y 0.503
0.362
10.228 0.663 5.322 0.295 55.733 7.930 158.405
A linear regression of log,0(time) versus load was fit. The investigators were particularly interested in estimating the slope of the true regression line relating these variables. Investigate the quality of the fit.
O A scatter plot of log10(time) versus load shows a reasonably linear pattern.
O A scatter plot of log10(time) versus load shows a curved pattem.
OA scatter plot of log10(time) versus load shows a random pattern.
Estimate the slope. (Round your answer to four decimal places.)
Predict time to failure when load is 80, in a way that conveys information about reliability and precision. (Calculate a 95% PI. Round your answers before making any data transformations to three decimal places. Round your final answers to two decimal places.)
For a rope at 80% of breaking load, we are 95% confident the failure time will be between a minimum of
hours and a maximum of
hours.
Expert Solution
This question has been solved!
Explore an expertly crafted, step-by-step solution for a thorough understanding of key concepts.

This is a popular solution!

Trending now
This is a popular solution!

Step by step
Solved in 2 steps with 2 images

Recommended textbooks for you
Glencoe Algebra 1, Student Edition, 9780079039897…
Algebra
ISBN:
9780079039897
Author:
Carter
Publisher:
McGraw Hill
Glencoe Algebra 1, Student Edition, 9780079039897…
Algebra
ISBN:
9780079039897
Author:
Carter
Publisher:
McGraw Hill