PowerPoint Slide Show - (BivarPart3ppbx) - PowerPoint Bivariate Analysis Bivariate analysis is a set of statistical analysis tools used to analyze two variables together. Why we need to study two variables together? In most of the cases two characteristics are Associated/Related. Height and Weight | Income and Spending| Þ
PowerPoint Slide Show - (BivarPart3ppbx) - PowerPoint Bivariate Analysis Bivariate analysis is a set of statistical analysis tools used to analyze two variables together. Why we need to study two variables together? In most of the cases two characteristics are Associated/Related. Height and Weight | Income and Spending| Þ

Big Ideas Math A Bridge To Success Algebra 1: Student Edition 2015
1st Edition
ISBN:9781680331141
Author:HOUGHTON MIFFLIN HARCOURT
Publisher:HOUGHTON MIFFLIN HARCOURT
Chapter11: Data Analysis And Displays
Section11.3: Shapes Of Distributions
Problem 14E

Related questions
Question
Transcribed Image Text:PowerPoint Slide Show - (BivarPart3.pptx)- PowerPoint
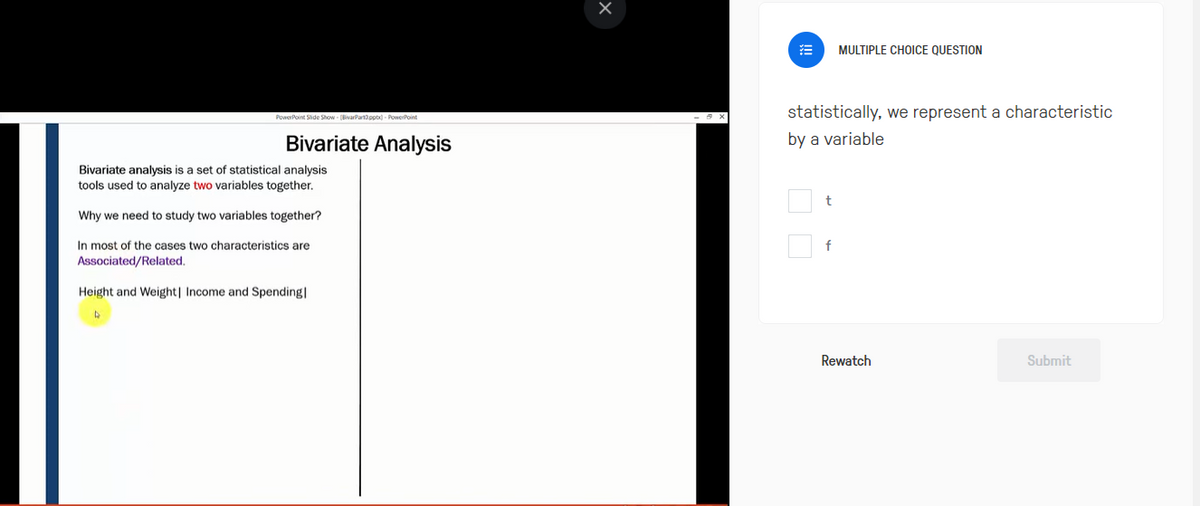
Bivariate Analysis
Bivariate analysis is a set of statistical analysis
tools used to analyze two variables together.
Why we need to study two variables together?
In most of the cases two characteristics are
Associated/Related.
Height and Weight| Income and Spending|
D
statistically, we represent a characteristic
by a variable
t
MULTIPLE CHOICE QUESTION
f
Rewatch
Submit
Expert Solution
This question has been solved!
Explore an expertly crafted, step-by-step solution for a thorough understanding of key concepts.

Step by step
Solved in 2 steps

Recommended textbooks for you
Big Ideas Math A Bridge To Success Algebra 1: Stu…
Algebra
ISBN:
9781680331141
Author:
HOUGHTON MIFFLIN HARCOURT
Publisher:
Houghton Mifflin Harcourt

Glencoe Algebra 1, Student Edition, 9780079039897…
Algebra
ISBN:
9780079039897
Author:
Carter
Publisher:
McGraw Hill

Algebra and Trigonometry (MindTap Course List)
Algebra
ISBN:
9781305071742
Author:
James Stewart, Lothar Redlin, Saleem Watson
Publisher:
Cengage Learning
Big Ideas Math A Bridge To Success Algebra 1: Stu…
Algebra
ISBN:
9781680331141
Author:
HOUGHTON MIFFLIN HARCOURT
Publisher:
Houghton Mifflin Harcourt
Glencoe Algebra 1, Student Edition, 9780079039897…
Algebra
ISBN:
9780079039897
Author:
Carter
Publisher:
McGraw Hill
Algebra and Trigonometry (MindTap Course List)
Algebra
ISBN:
9781305071742
Author:
James Stewart, Lothar Redlin, Saleem Watson
Publisher:
Cengage Learning