prding to a local survey, 38% of those living in Denmark claim to wey, 64% of those living in Denmark reported not knowing how t -way table represents this information?
prding to a local survey, 38% of those living in Denmark claim to wey, 64% of those living in Denmark reported not knowing how t -way table represents this information?

Glencoe Algebra 1, Student Edition, 9780079039897, 0079039898, 2018
18th Edition
ISBN:9780079039897
Author:Carter
Publisher:Carter
Chapter10: Statistics
Section10.6: Summarizing Categorical Data
Problem 28PPS

Related questions
Question
Hello can you help me with this please
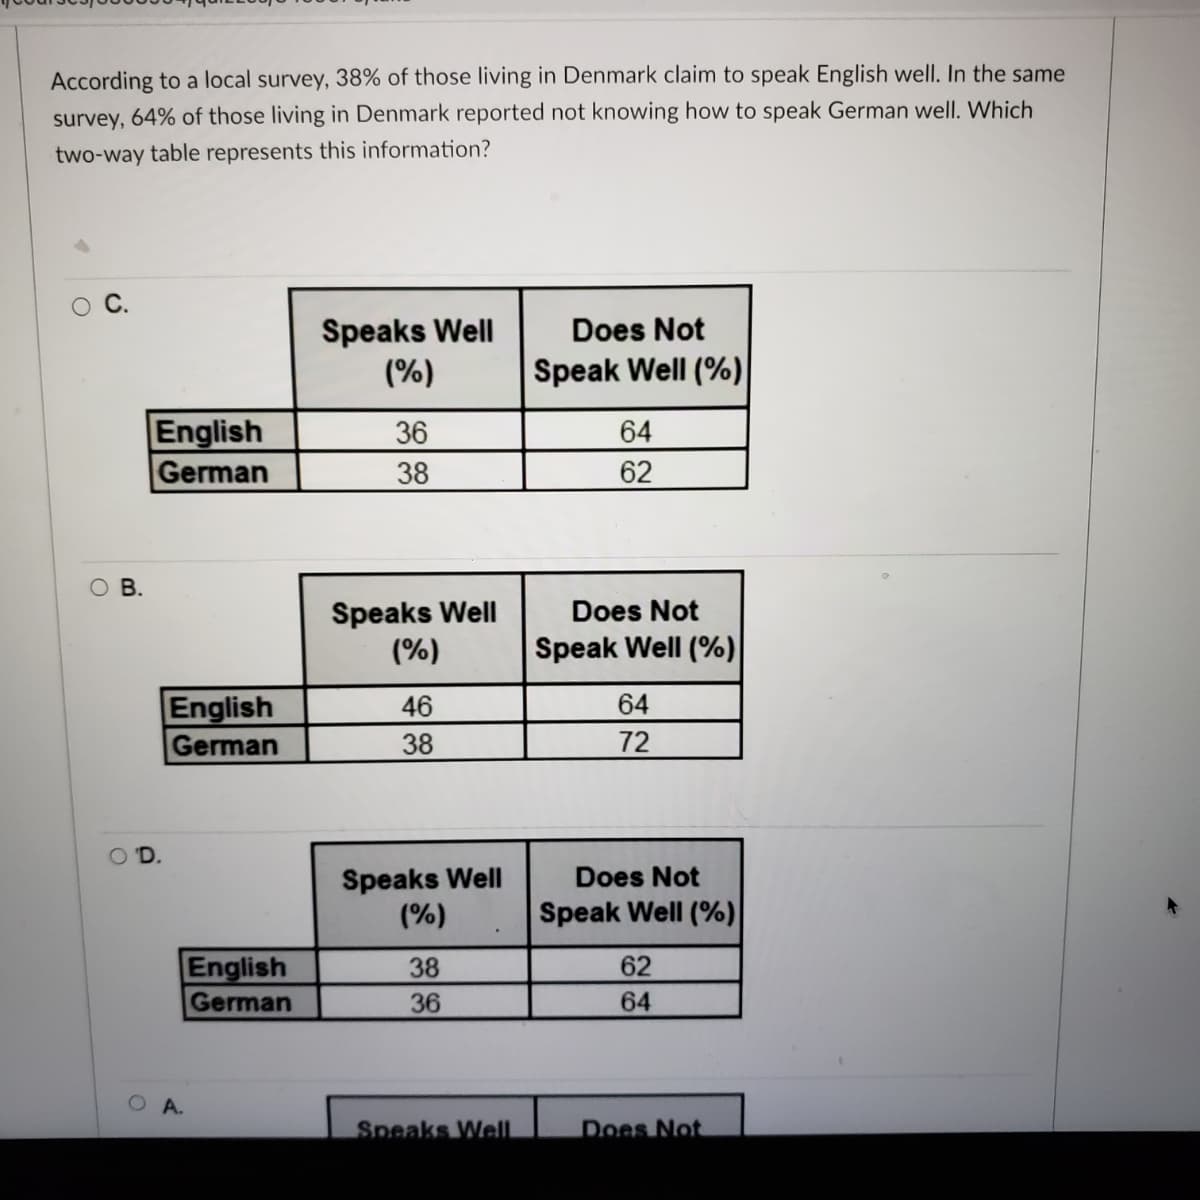
Transcribed Image Text:According to a local survey, 38% of those living in Denmark claim to speak English well. In the same
survey, 64% of those living in Denmark reported not knowing how to speak German well. Which
two-way table represents this information?
Speaks Well
(%)
Does Not
Speak Well (%)
English
German
36
64
38
62
ов.
Speaks Well
(%)
Does Not
Speak Well (%)
English
46
64
German
38
72
O D.
Speaks Well
(%)
Does Not
Speak Well (%)
English
German
38
62
36
64
A.
Speaks Well
Does Not
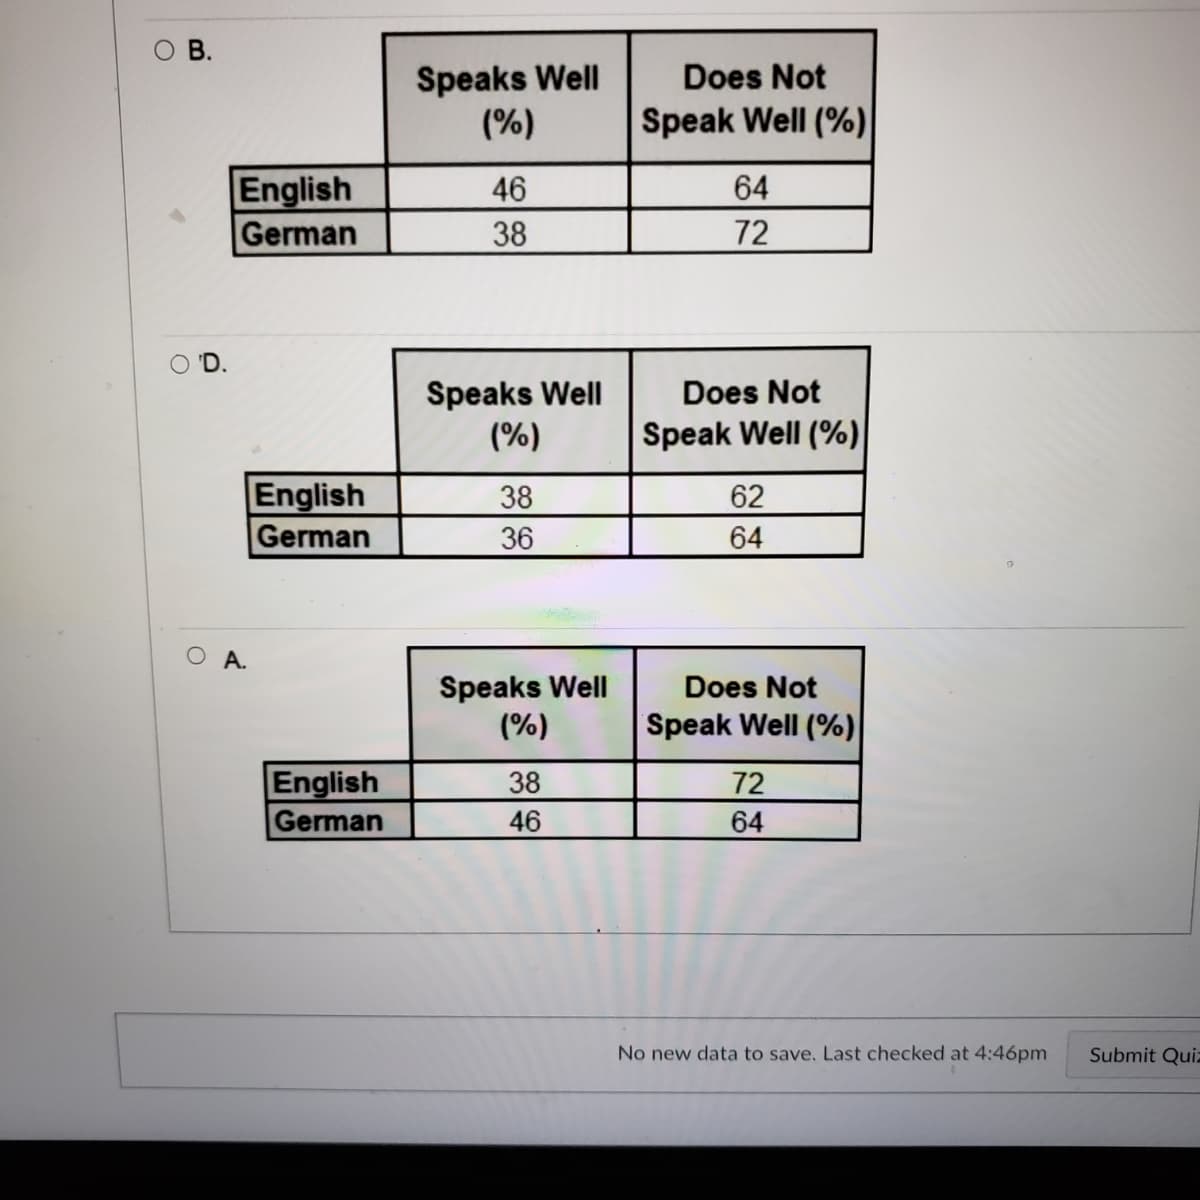
Transcribed Image Text:В.
Speaks Well
(%)
Does Not
Speak Well (%)
English
German
64
72
46
38
O 'D.
Speaks Well
(%)
Does Not
Speak Well (%)|
English
38
62
German
36
64
А.
Speaks Well
(%)
Does Not
Speak Well (%)
English
German
38
72
46
64
No new data to save. Last checked at 4:46pm
Submit Quiz
Expert Solution
This question has been solved!
Explore an expertly crafted, step-by-step solution for a thorough understanding of key concepts.

This is a popular solution!

Trending now
This is a popular solution!

Step by step
Solved in 2 steps

Recommended textbooks for you
Glencoe Algebra 1, Student Edition, 9780079039897…
Algebra
ISBN:
9780079039897
Author:
Carter
Publisher:
McGraw Hill

Holt Mcdougal Larson Pre-algebra: Student Edition…
Algebra
ISBN:
9780547587776
Author:
HOLT MCDOUGAL
Publisher:
HOLT MCDOUGAL
Glencoe Algebra 1, Student Edition, 9780079039897…
Algebra
ISBN:
9780079039897
Author:
Carter
Publisher:
McGraw Hill
Holt Mcdougal Larson Pre-algebra: Student Edition…
Algebra
ISBN:
9780547587776
Author:
HOLT MCDOUGAL
Publisher:
HOLT MCDOUGAL