- In one computer class, 20 students got an 'A', 12 students got a 'B, 10 students got a 'C' and 8 students got a 'D’. a. If the teacher were to make a pie chart to display the percentage of students by grade, what percentage of the pie chart would be devoted to the slice that represents the students who got an A'? b. Besides a pie chart, specify one additional graphical summary that would be appropriate to represent this variable (student grade in computer class).
- In one computer class, 20 students got an 'A', 12 students got a 'B, 10 students got a 'C' and 8 students got a 'D’. a. If the teacher were to make a pie chart to display the percentage of students by grade, what percentage of the pie chart would be devoted to the slice that represents the students who got an A'? b. Besides a pie chart, specify one additional graphical summary that would be appropriate to represent this variable (student grade in computer class).

Big Ideas Math A Bridge To Success Algebra 1: Student Edition 2015
1st Edition
ISBN:9781680331141
Author:HOUGHTON MIFFLIN HARCOURT
Publisher:HOUGHTON MIFFLIN HARCOURT
Chapter11: Data Analysis And Displays
Section: Chapter Questions
Problem 10CT

Related questions
Question
please i want solve q1 and q2
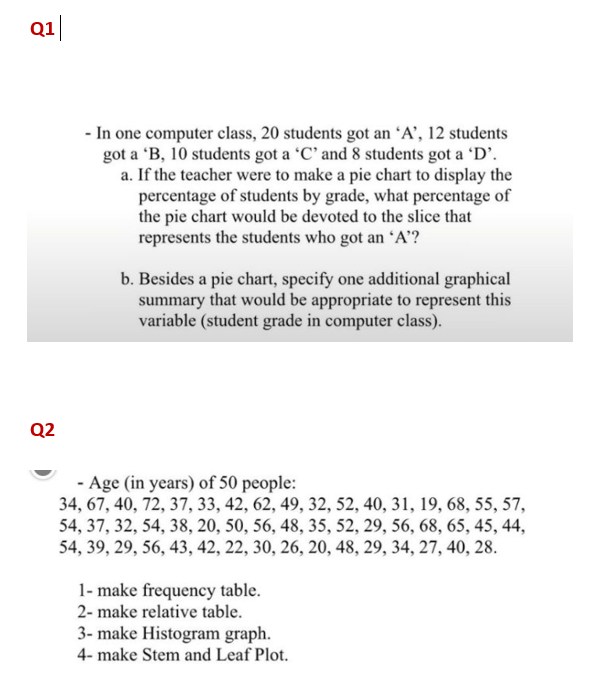
Transcribed Image Text:Q1|
- In one computer class, 20 students got an 'A', 12 students
got a 'B, 10 students got a 'C' and 8 students got a 'D’.
a. If the teacher were to make a pie chart to display the
percentage of students by grade, what percentage of
the pie chart would be devoted to the slice that
represents the students who got an A'?
b. Besides a pie chart, specify one additional graphical
summary that would be appropriate to represent this
variable (student grade in computer class).
Q2
- Age (in years) of 50 people:
34, 67, 40, 72, 37, 33, 42, 62, 49, 32, 52, 40, 31, 19, 68, 55, 57,
54, 37, 32, 54, 38, 20, 50, 56, 48, 35, 52, 29, 56, 68, 65, 45, 44,
54, 39, 29, 56, 43, 42, 22, 30, 26, 20, 48, 29, 34, 27, 40, 28.
1- make frequency table.
2- make relative table.
3- make Histogram graph.
4- make Stem and Leaf Plot.
Expert Solution
This question has been solved!
Explore an expertly crafted, step-by-step solution for a thorough understanding of key concepts.

This is a popular solution!

Trending now
This is a popular solution!

Step by step
Solved in 3 steps

Recommended textbooks for you
Big Ideas Math A Bridge To Success Algebra 1: Stu…
Algebra
ISBN:
9781680331141
Author:
HOUGHTON MIFFLIN HARCOURT
Publisher:
Houghton Mifflin Harcourt

Glencoe Algebra 1, Student Edition, 9780079039897…
Algebra
ISBN:
9780079039897
Author:
Carter
Publisher:
McGraw Hill
Big Ideas Math A Bridge To Success Algebra 1: Stu…
Algebra
ISBN:
9781680331141
Author:
HOUGHTON MIFFLIN HARCOURT
Publisher:
Houghton Mifflin Harcourt
Glencoe Algebra 1, Student Edition, 9780079039897…
Algebra
ISBN:
9780079039897
Author:
Carter
Publisher:
McGraw Hill