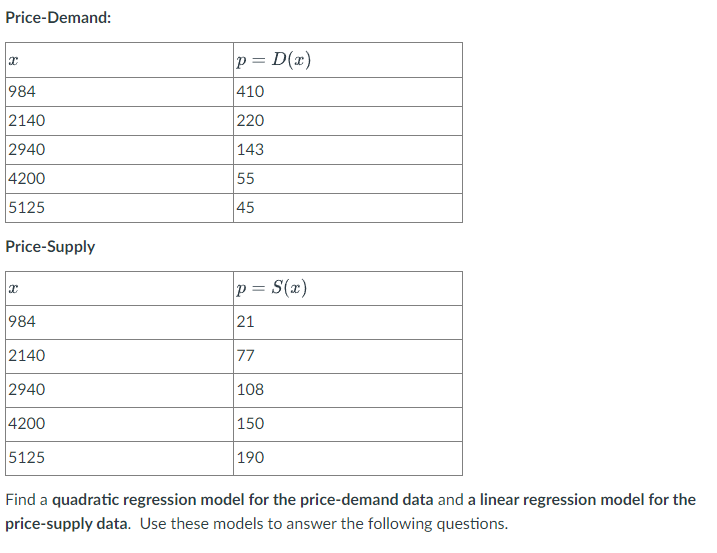
Price-Demand: p = D(x) 984 410 2140 220 2940 |143 4200 55 5125 45 Price-Supply p = S(x) 984 21 2140 77 2940 108 4200 |150 5125 190 Find a quadratic regression model for the price-demand data and a linear regressio price-supply data. Use these models to answer the following questions.


Q: A firm's production is given by f (L, K) = min(3L, 2K), and it faces input prices w = $30/hr and r =
A: Given; Production function; f(L,K)=16min(3L,2K) Price of labor; w=$30 per hours Price of capital; r=…
Q: Discuss monopoly markets and the ethical weaknesses of monopolies.
A: Market refers to the process through which buyers and sellers come to an agreement on the price and…
Q: Is Economics an Administrative Science?
A: Science is an art that depicts the logical reasoning behind subjects and topics.
Q: It has been determined that the cost of producing x units of a certain item is 8x + 365. The demand…
A: Revenue is the income earned by selling the product at given price level. Revenue function is the…
Q: The demand curve for milk can be represented by the following equation: Q = 6000 – 800P There are…
A: the Bertrand–Edgeworth model of price-setting oligopoly looks at what happens when there is a…
Q: If a firm has an accounting profit it must have an economic profit. O True
A: Profit = total revenue - total cost
Q: is it true or false In Cass-Ramsey-Koopmans model, the optimal savings rate is determined by the…
A: The Ramsey–Cass–Koopmans model is mainly for economic growth in the long run rather than business…
Q: QUESTION 8 Assume potential GDP is 3,500 and actual GDP is 3,050. If the consumption function is…
A: The consumption function shows the positive relationship between consumption and disposable income.…
Q: Milton Friedman argued nearly all economic fluctuations were caused by Multiple Choice sticky…
A: The correct option is money supply. Milton Friedman argued nearly all economic fluctuations were…
Q: Which pair below are examples of automatic stabilisers? O taxes and welfare payments saving and…
A: When talking about automatic stabilizers, it can be said that these are the government programs or…
Q: Suppose that there is limited commitment in the credit market, but lenders are uncertain about the…
A: The credit market, also known as the debt market, is where businesses and governments sell debt to…
Q: Using the AD/AS model, a tax change shifts O only the AS curve as it is a supply-side policy only…
A: Tax policy has an impact on both consumption and investment spending.
Q: For an IS/LM model of an economy with the following equations: C = 200 + 0.8Yd I = 220 – 25i G…
A: IS-LM In the IS LM curves of equilibrium, (IS) is the goods market and (LM) is the money market.…
Q: The theory that emphasizes the importance of transportation routes is called __________ theory.
A: Meaning of Macroeconomics: The term macroeconomics refers to the situation of economic and…
Q: The whole economy is composed of small units, and these small units transfer funds from one another.…
A: An economy is the place where people live and make economic activities to survive and earn income to…
Q: Suppose consumers experience an increase in income. If the income elasticity of demand is equal to…
A: Income elasticity of demand measures the responsiveness in quantity demanded of a commodity to a…
Q: Susan hires Joe to mow her grass every week for eight weeks. They agree on a price. Which kind of…
A: At a marketplace, the contract between two or more parties depends upon their written and oral…
Q: Assume a firm's short run total cost is STC = cSR = 10q + 10,/q + 10. Compute its marginal cost and…
A: Given Firm's short-run cost function STC(q)=10q+10q+10 ... (1)
Q: Using the IS/LM model, a monetary policy contraction O shifts the LM curve to the left, raising…
A: Monetary policy is generally steps which are taken by the central bank in order to stabilize the…
Q: Now, assume your buffalo wing firm is in a Cournot oligopoly with 3 additional firms. The market…
A: Relationship between individual's elasticity of demand and market elasticity of demand. EF = N * EM…
Q: A tariff-rate quota O a. displays either tariff-like or quota-like characteristics O b. tends to…
A: The tax that is being imposed by one country on the services and goods that are being imported from…
Q: The following table shows expenditure components of GDP in billions of dollars for a. country during…
A: Use the below formula: GDP = C +I + G + NXC = ConsumptionI = InvestmentG = Government spendingNX =…
Q: real business cycle theory suggest that _______ not important in explaining short-term fluctuations…
A: The Real business cycle theory states that the fluctuations in the economy are largely explained by…
Q: at the graph of a perfectly competitive firm and its average total cost curve is entirely above the…
A: In a perfectly competitive market there are large number of firms producing similar and identical…
Q: recently won the lottery and is pursuing his dream to be a photographer. Dick's wife, Janine, is a…
A: The answer is as follows:-
Q: 8. Short-run and long-run effects of a shift in demand Suppose that the turkey industry is in…
A: The turkey industry is in long-run equilibrium at price of $5 per pound of turkey and a quantity of…
Q: According to Keynes’ Law... Group of answer choices The total demand tends to rise above the total…
A: Keynesian economics is highly significant to explain the nature of a market using a specfiic…
Q: expain the Interrelationship between money markets and capital markets .give examples
A: Trading in extremely short-term debt assets is referred to as the money market.It includes…
Q: You are the manager of a monopoly. Your analytics department estimates that a typical consumer's…
A:
Q: Please write a summary on Financial Crisis 2007-2008?
A: The 2007-2008 financial crisis that is also known as the Global Financial Disaster, was a…
Q: Assuming that each of the following functions are linear, give an economic interpretation of the…
A: The correct answer is given in the second step.
Q: Sutility LW 2 VP. where PxX = w × L and 0<LS 24 PL V24-4 2. Jane's utility maximization problem can…
A: A utility function refers to a function that assigns a real number to each item of consumer goods or…
Q: Which of the following statements represent a use of money that is not consistent with its…
A: Money is a commodity that is commonly acknowledged as a medium of exchange for goods and services.…
Q: low-cost range for multiple alternatives. variable location fixed cost cost/unit elm 125 .01 ferry…
A:
Q: The slope of the AS curve reflects short-run versus long-run, wage flexibility, Classical versus…
A: The resources which are present with the economies around the globe are limited in nature, while the…
Q: Question 3 low-cost range for multiple alternatives. variable location fixed cost cost/unit elm 125…
A:
Q: 2. (a) Given the marginal propensity to import M'(Y) = 0.1 and the information that M = 20 when Y =…
A: Answer: (a). Given, Marginal propensity to import M'Y=0.1At Y=0, M=20 Let us integrate both sides of…
Q: Question 1 Given the following data for a country A for the year ended December 2021 Items Private…
A:
Q: QUESTION 14 Assume potential GDP is 4,000 and actual GDP is 3,000 if the consumption function is…
A: Full employment refers to the situation where the potential GDP is equal to the real GDP. It means…
Q: or many airlines in the short run, a major portion of the cost of production, such as aircraft and…
A: Fixed Cost: The fixed cost refers to the cost that is fixed and does not change irrespective of…
Q: In 2020 if government investment spending was €4bn, government consumption spending was €10bn, and…
A: Given: The government investment spending = €4billion The government consumption spending = €10…
Q: 5. Consider a software company which has considerable market power over one of its products. The…
A: In economics, profit maximization is the short run or long run process by which a firm may determine…
Q: Under the new incarnation or the Phillips curve (where inflation is persistent). derive the natural…
A: Phillips Curve is defined as a curve which states a relationship between inflation and unemployment.…
Q: Project A requires an immediate investment of $8000 and another $6000 in three years. Net returns…
A: Net Present Value is the value of all future cash flows (positive and negative) discounted to the…
Q: Which of the following policies does not shift the aggregate supply curve to the right?
A: (1) The aggregate supply (AS) curve depicts the total supply of goods and services at each price…
Q: Explain how the level of transactions costs influences the choice of the appropriate legal rule for…
A: Transaction costs indicate the labor required to bring a product or service to market. It has…
Q: Funds from the deficient sectors are usually used to finance the sectors facing surplus of funds. *…
A: In a market, people make an exchange of funds based on their requirements and their interest, which…
Q: ction of these goods for 3 years are shown below along with their prices. If is the base year, the…
A: Nominal GDP is measures market value of goods and services using current prices whereas Real GDP is…
Q: C = 200 + 0.8Yd I = 220 – 25i G Bar = 240 TR BAR = 150 T = .2Y L = .1Y – 3i…
A: The IS-LM model demonstrates the interaction of the asset market and the goods market. The IS curve…
What is the


Trending now
This is a popular solution!

Step by step
Solved in 2 steps with 8 images


- Hello, I am trying to find the equations on my calculator for the price-demand and price supply equations. The data is in the attached image. I think I am doing something wrong, but not sure what. I found the quadratic regression model for the first set of data using my calculator, but I used the p=D(x) as list one, and x, as list two. I came up with 0.028x^2-23x +5743 is this right? or do I need the reverse the order? For the price-supply data I but the p=S(x) as list 1 and x as list 2 and I got the linear regression function: 2 5.1x+342 Can you please let me know if I am on the right track?Suppose that an economist has been able to gather data on the relationship between demand and price for a particular product. After analyzing scatterplots and using economic theory, the economist decides to estimate an equation of the form Q= aPb, where Q is quantity demanded and P is price. An appropriate regression analysis is then performed, and the estimated parameters turn out to be a = 1000 and b = - 1.3. Now consider two scenarios: (1) the price increases from $10 to $12.50; (2) the price increases from $20 to $25. a. Do you predict the percentage decrease in demand to be the same in scenario 1 as in scenario 2? Why or why not? b. What is the predicted percentage decrease in demand in scenario 1? What about scenario 2? Be as exact as possible.The following data relate the sales figures of the bar in Mark Kaltenbach's small bed-and-breakfast inn in portland, to the number of guest registered that week: week guests bar sales 1 16 $330 2 12 $270 3 18 $380 4 14 $315 a) The simple linear regression equation that relates bar sales to number of guests(not to time) is (round your responses to one decimal place): Bar sales = [___]+[___]X guests
- Consider the following data regarding students' college GPAs and high school GPAs. The estimated regression equation is Estimated College GPA=1.85+0.4743(High School GPA).Estimated College GPA=1.85+0.4743(High School GPA). GPAs College GPA High School GPA 3.843.84 2.562.56 3.573.57 3.903.90 2.072.07 3.143.14 4.004.00 3.223.22 3.873.87 2.882.88 2.212.21 2.082.08 Copy Data Step 1 of 3 : Compute the sum of squared errors (SSE) for the model. Round your answer to four decimal places.Imagine you are trying to explain the effect of square footage on home sale prices in the United States. You collect a random sample of 100,000 homes that recently sold. a) Homes can be one of three types: single-family houses, townhomes, or condos. How would you control for a home’s type in a regression model? b) Write down a regression model that includes controls for home type, square footage, and number of bedrooms. c) How would you interpret the es3mated coefficients for each of the variables from part b? Be specific.Sally Sells Sea Shells by the Sea Shore and collects all sales dataNow she is curious to find out what the elasticity of demand is for her shells Assume they are all the same type and quantity She scatter plots the data and finds there is a linear relationship that looks ripe for a regression estimation of the price response function for her shells The slope of her regression line is 61. Currently, her average daily price is 11.74 and she sells 95 quantity at that priceCalculate the point elasticity of demand for her sea shells
- What is a linear regression model? What is measured by the coefficients ofa linear regression model? What is the ordinary least squares estimator?An economic research centre has published data on GDP and Demand for refrigerators as given below:Year 2011 2012 2013 2014 2015 2016 2017GDP (billion) 20 22 25 27 30 33 35Refrigerator 50 60 80 80 90 100 120(a) Estimate regression equation R= a+by, where R= No of refrigerator sold and Y= GDP.Forecast demand for refrigerator in the year 2018 and 2019. The research centre has projected GDP for 2018 and 2019 at Rs. 38 billion and Rs. 40 billion respectively.Below table contains a data sample where X is the independent, and Y the dependent variable. Using the data, please conduct a regression analysis. Determine first the regression equation with the help of below graph and table, then answer all the questions. 1. The value of cell a is 2. The value of cell b is 3: The value of cell c is 4: The value of cell d is 5: The value of cell e is 6: The value of cell f is 7: The value of cell g is 8. The value of cell h is 9: The value of cell i is 10: The value of cell j is 11: The value of cell k is 12: The value of cell l is 13: The value of cell m is 14: The value of cell n is 15: The value of cell o is 16: The value of cell p is 17: The value of cell q is 18: The value of cell r is 19: The value of cell s is 20: The value of cell t is 21: The value of cell u is 22: The value of cell v is 23: The value of cell w is 24: The value of cell x is 25: The value of cell y is 26: The value of cell z is 27: The value of cell aa is 28: The value of cell…
- General Cereals is using a regression model to estimate the demand for Tweetie Sweeties, a whistle-shaped, sugar-coated breakfast cereal for children. The following (multiplicative exponential) demand function is being used: QD=6,280 P(−1.85)A2.05N2.70QD=6,280 P−1.85A2.05N2.70 where QDQD = quantity demanded, in 10-oz boxes PP = price per box, in dollars AA = advertising expenditures on daytime television, in dollars NN = proportion of the population under 12 years old, in percent What is the point price elasticity of demand for Tweetie Sweeties? 2.05 2.70 -0.90 -1.85 What is the advertising elasticity of demand? 0.76 -1.85 2.70 2.05A manufacturer is developing a facility plan to provide production capacity for its factory. The amount of capacity required in the future depends on the number of products demanded by its customers. The data below reflect past sales of its products: Year Annual Sales (number of products) Year Annual Sales (number of products) 1 490 5 461 2 487 6 475 3 492 7 472 4 478 8 458 Use simple linear regression to forecast annual demand for the products for each of the next three (3) years, by using the tabular method to: derive the values for the intercept and slope derive the linear equation plot the linear regression line develop a forecast for the firm’s annual sales for each of the next three yearsThe 2008 sales and profits of seven companies were given as follows Firm Sales ($ Billions) Profit ($ Billions) Fiat 5.7 0.27 Honda 6.7 0.12 BP 0.2 0.01 Toyota 0.6 0.04 Apple 3.8 0.05 IBM 12.5 0.46 Phillips 0.5 0.02 The estimated value for the company’s Profit can be estimated using the equation; Y ̂i = α ̂ + β ̂Xi……………………………………………………………………Eqn.1 Where; Y = Companies Profit X = Companies Sales α ̂ and β ̂ are estimated parameters in the model Calculate the sample regression line, where profit is the dependent variable (Y) and sales is the independent variable (X)