Price (dollars per pizza) 15 14 13 12 D. 10 9. 50 100 150 200 250 300 350 Quantity (thousands of pizzas per day) The above figure shows the market for pizza. The market is in equilibrium. Pizza and tacos are substitutes for consumers. The price of tacos falls. What point represents the most likely new price and quantity? A) D
Price (dollars per pizza) 15 14 13 12 D. 10 9. 50 100 150 200 250 300 350 Quantity (thousands of pizzas per day) The above figure shows the market for pizza. The market is in equilibrium. Pizza and tacos are substitutes for consumers. The price of tacos falls. What point represents the most likely new price and quantity? A) D

Chapter3: Supply And Demand: Theory
Section: Chapter Questions
Problem 23QP

Related questions
Question
100%
Transcribed Image Text:Price (dollars per pizza)
15
14
13
12
E
D.
10
50
100
150
200
250
300
350
Quantity (thousands of pizzas per day)
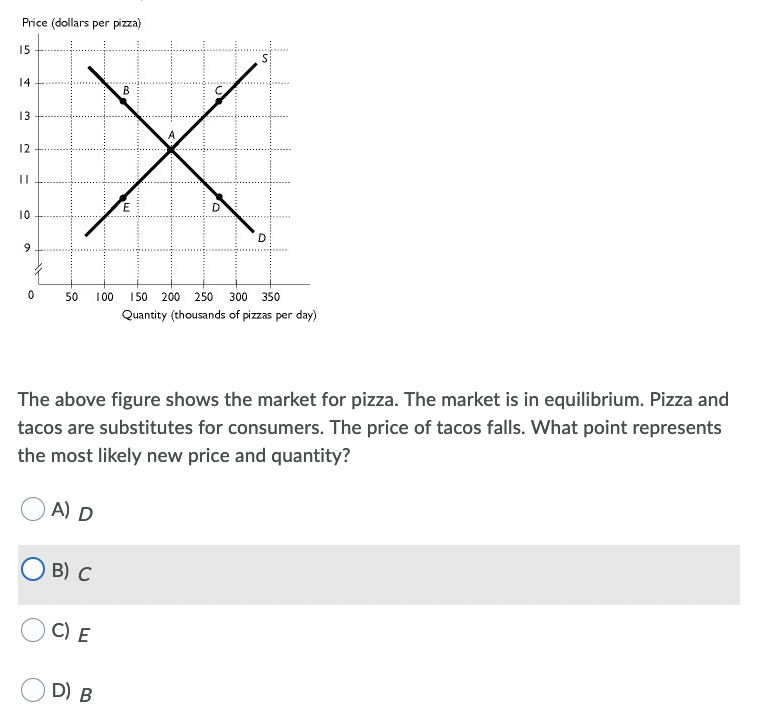
The above figure shows the market for pizza. The market is in equilibrium. Pizza and
tacos are substitutes for consumers. The price of tacos falls. What point represents
the most likely new price and quantity?
A) D
B) C
C) E
D) B
Expert Solution
Step 1
Answer is given below

Trending now
This is a popular solution!

Step by step
Solved in 2 steps with 1 images

Knowledge Booster


Learn more about
Need a deep-dive on the concept behind this application? Look no further. Learn more about this topic, economics and related others by exploring similar questions and additional content below.Recommended textbooks for you

Economics (MindTap Course List)
Economics
ISBN:
9781337617383
Author:
Roger A. Arnold
Publisher:
Cengage Learning

Economics (MindTap Course List)
Economics
ISBN:
9781337617383
Author:
Roger A. Arnold
Publisher:
Cengage Learning


