Price £/unit E B. 'D3 D1 D2 Quantity Figure 4 Supply and demand curves for a normal good Figure 4 shows a supply (S1) and demand curve (D;) for a normal good – illustrated by the continuous lines. Both curves may shift left or right depending on the situation described below, as illustrated by the dotted and dashed lines. The market is initially in equilibrium at point E given by the intersection of the supply curve S, and demand curve D1. Consider the situation below and select the letter that corresponds to the new point of equilibrium that would arise in the market from the list provided. • Amajor natural disaster disrupts production
Price £/unit E B. 'D3 D1 D2 Quantity Figure 4 Supply and demand curves for a normal good Figure 4 shows a supply (S1) and demand curve (D;) for a normal good – illustrated by the continuous lines. Both curves may shift left or right depending on the situation described below, as illustrated by the dotted and dashed lines. The market is initially in equilibrium at point E given by the intersection of the supply curve S, and demand curve D1. Consider the situation below and select the letter that corresponds to the new point of equilibrium that would arise in the market from the list provided. • Amajor natural disaster disrupts production

Chapter6: Demand Relationships Among Goods
Section: Chapter Questions
Problem 6.12P

Related questions
Question
Transcribed Image Text:Price
£/unit
'D3
D1
D2
Quantity
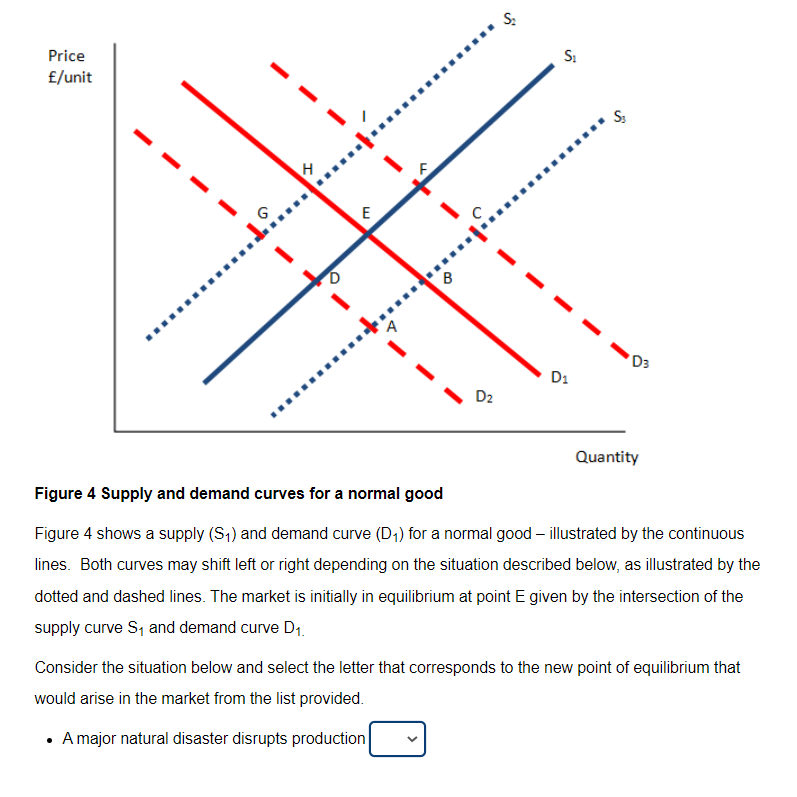
Figure 4 Supply and demand curves for a normal good
Figure 4 shows a supply (S,) and demand curve (D;) for a normal good – illustrated by the continuous
lines. Both curves may shift left or right depending on the situation described below, as illustrated by the
dotted and dashed lines. The market is initially in equilibrium at point E given by the intersection of the
supply curve S, and demand curve D1.
Consider the situation below and select the letter that corresponds to the new point of equilibrium that
would arise in the market from the list provided.
A major natural disaster disrupts production
Transcribed Image Text:D3
D1
D2
Quantity
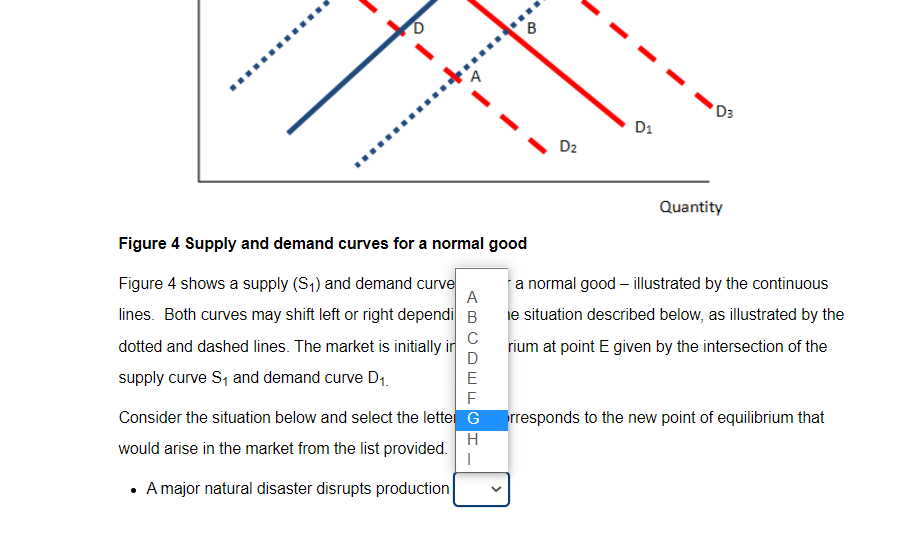
Figure 4 Supply and demand curves for a normal good
Figure 4 shows a supply (S1) and demand curve
A
a normal good – illustrated by the continuous
lines. Both curves may shift left or right dependi B
ie situation described below, as illustrated by the
dotted and dashed lines. The market is initially in
D
rium at point E given by the intersection of the
supply curve S, and demand curve D1.
E
Consider the situation below and select the lettel G
rresponds to the new point of equilibrium that
would arise in the market from the list provided.
A major natural disaster disrupts production
Expert Solution
This question has been solved!
Explore an expertly crafted, step-by-step solution for a thorough understanding of key concepts.

This is a popular solution!

Trending now
This is a popular solution!

Step by step
Solved in 2 steps

Knowledge Booster


Learn more about
Need a deep-dive on the concept behind this application? Look no further. Learn more about this topic, economics and related others by exploring similar questions and additional content below.Recommended textbooks for you