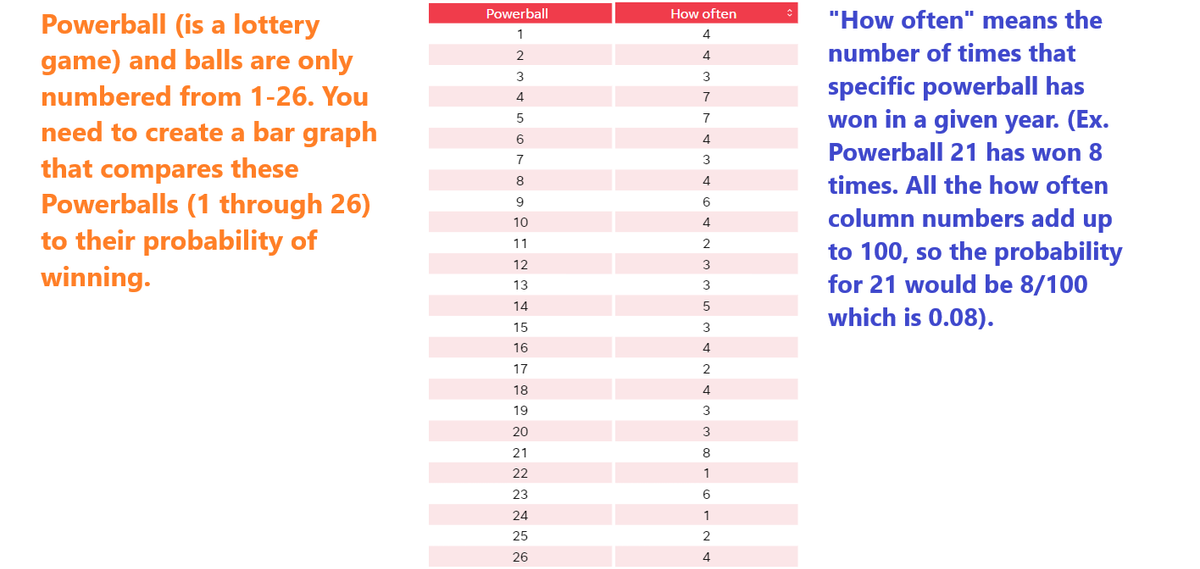
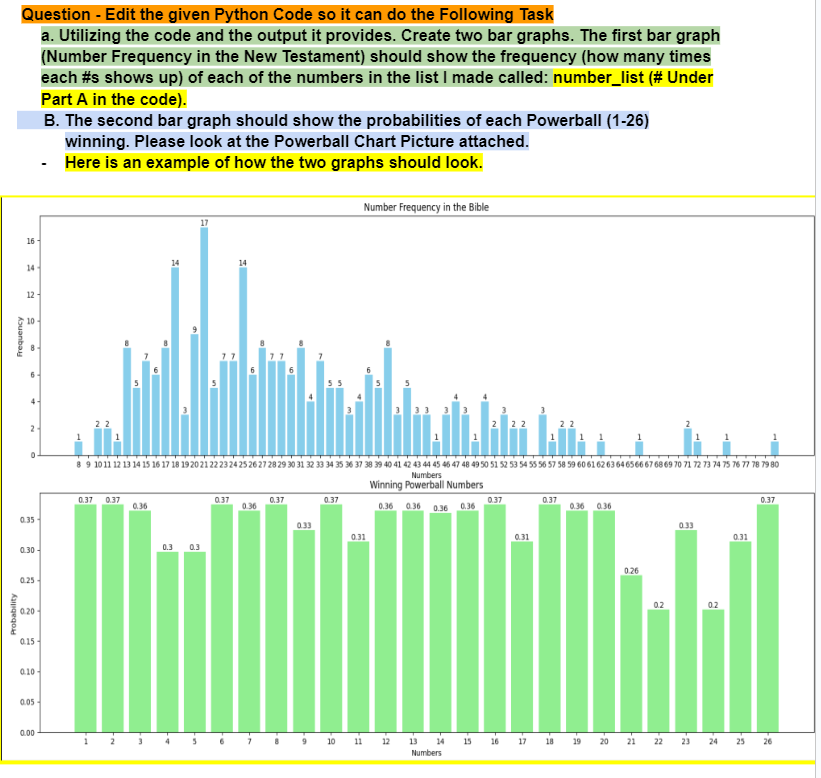
Powerball (is a lottery game) and balls are only numbered from 1-26. You need to create a bar graph that compares these Powerballs (1 through 26) to their probability of winning. Powerball How often 1 4 2 4 3 3 4 7 5 7 6 4 7 3 8 4 9 6 10 4 11 2 12 3 21 STRAT₤22222222 13 3 14 5 15 3 16 4 17 2 18 4 19 3 20 3 8 1 23 6 24 1 25 2 26 4 "How often" means the number of times that specific powerball has won in a given year. (Ex. Powerball 21 has won 8 times. All the how often column numbers add up to 100, so the probability for 21 would be 8/100 which is 0.08). Probability Frequency Question - Edit the given Python Code so it can do the Following Task a. Utilizing the code and the output it provides. Create two bar graphs. The first bar graph (Number Frequency in the New Testament) should show the frequency (how many times each #s shows up) of each of the numbers in the list I made called: number_list (# Under Part A in the code). B. The second bar graph should show the probabilities of each Powerball (1-26) winning. Please look at the Powerball Chart Picture attached. Here is an example of how the two graphs should look. 16 17 14 14 14 12- 2- 0 + 4 Number Frequency in the Bible 8 9 10 11 12 13 14 15 16 17 18 19 20 21 22 23 24 25 26 27 28 29 30 31 32 33 34 35 36 37 38 39 40 41 42 43 44 45 46 47 48 49 50 51 52 53 54 55 56 57 58 59 60 61 62 63 64 65 66 67 68 69 70 71 72 73 74 75 76 77 78 79 80 Numbers 0.37 0.37 0.36 0.35- 0.30- 0.25 0.20- 015 0.10- 0.05- 0.00 1 N. 3 0.3 0.3 0.37 0.37 0.36 Winning Powerball Numbers 0.37 0.37 0.37 0.36 0.36 0.36 0.36 0.36 0.36 0.33 0.31 0.33 0.31 0.31 7 8 9 10 11 12 13 14 15 16 17 18 19 Numbers 0.26 02 02 20 21 22 23 24 25 26 0.37


Edit the given Python Code (about Probability) so it can also output two Bar Graphs. Please see the attached pics to complete it.
Code that Needs to be Edited:
from collections import Counter
from scipy.stats import binom
# Part A: Find the 7 most common repetitive numbers
number_list = [25, 23, 17, 25, 48, 34, 29, 34, 38, 42, 30, 50, 58, 36, 39, 28, 27, 35, 30, 34, 46, 46, 39, 51, 46, 75,
66, 20, 45, 28, 35, 41, 43, 56, 37, 38, 50, 52, 33, 44, 37, 72, 47, 20, 80, 52, 38, 44, 39, 49, 50, 56,
62, 42, 54, 59, 35, 35, 32, 31, 37, 43, 48, 47, 38, 71, 56, 53, 51, 25, 36, 54, 47, 71, 53, 59, 41, 42,
57, 50, 38, 31, 27, 33, 26, 40, 42, 31, 25, 26, 47, 26, 37, 42, 15, 60, 40, 43, 48, 30, 25, 52, 28, 41,
40, 34, 28, 40, 38, 40, 30, 35, 27, 27, 32, 44, 31, 32, 29, 31, 25, 21, 23, 25, 39, 33, 21, 36, 21, 14,
23, 33, 27, 31, 16, 23, 21, 13, 20, 40, 13, 27, 33, 34, 31, 13, 40, 58, 24, 24, 17, 18, 18, 21, 18, 16,
24, 15, 18, 33, 21, 13, 24, 21, 29, 31, 26, 18, 23, 22, 21, 32, 33, 24, 30, 30, 21, 23, 29, 23, 25, 18,
10, 20, 13, 18, 28, 12, 17, 18, 20, 15, 16, 16, 25, 21, 18, 26, 17, 22, 16, 15, 15, 25, 14, 18, 19, 16,
14, 20, 28, 13, 28, 39, 40, 29, 25, 27, 26, 18, 17, 20, 25, 25, 22, 19, 14, 21, 22, 18, 10, 29, 24, 21,
21, 13, 15, 25, 20, 29, 22, 11, 14, 17, 17, 13, 21, 11, 19, 17, 18, 20, 8, 21, 18, 24, 21, 15, 27, 21]
number_count = Counter(number_list)
most_common = number_count.most_common(7)
print("Most Common Numbers in New Testament:")
for num, count in most_common:
print(f"Number {num} appears {count} times")
# Part B: Find the 7 most uncommon numbers
least_common = number_count.most_common()[:-8:-1]
print("\nLeast Common Numbers in New Testament:")
for num, count in least_common:
print(f"Number {num} appears {count} times")
# Part C: Use binomial distribution to find the probability of each of the 7 common repetitive numbers
print("\nProbabilities of 7 Most Common Numbers (Using Binomial Distribution):")
for num, count in most_common:
total_trials = len(number_list)
successes = count
probability = binom.pmf(successes, total_trials, successes/total_trials)
print(f"Probability of seeing {num} appear exactly {count} times: {probability:.4f}")
print("\nProbabilities of 7 Most Common Numbers from the New Testament Winning the Powerball:")
# The provided "how often" data from the table
how_often_data = {
1: 4, 2: 4, 3: 3, 4: 7, 5: 8, 6: 4, 7: 3, 8: 4, 9: 6, 10: 3,
11: 2, 12: 3, 13: 3, 14: 5, 15: 2, 16: 5, 17: 2, 18: 4, 19: 3,
20: 4, 21: 8, 22: 1, 23: 5, 24: 1, 25: 2, 26: 4
}
# The total count of all occurrences
total_count = sum(how_often_data.values())
# The specific numbers we need to find the probabilities for
requested_numbers = [17, 18, 20, 21, 25, 27, 31]
# Calculate the probabilities
probabilities = {number: how_often_data.get(number, 0) / total_count for number in requested_numbers}
def print_probability(number, probability):
if number in how_often_data:
print(f"Probability of Number {number} being a winning number for Powerball: {probability:.4f}")
else:
print(f"Probability of Number {number} being a winning number is 0 because it is not a Powerball number.")
for number in requested_numbers:
print_probability(number, probabilities[number])

Step by step
Solved in 2 steps with 2 images


