import timeit import random import matplotlib.pyplot as plt # Function to count crossings and nestings def count_crossings_and_nestings (matching): # Your implementation of count_crossings_and_nestings goes here pass # Function to generate random matching def random_matching (length): # Your implementation of random_matching goes here pass # Measure the average run times against the lengths of the matchings x = [n for n in range(1, 51)] # 50 arcs y_matching = [ ] for length in x: avg_runtime = timeit.timeit(lambda: count_crossings_and_nestings (random_matching (length)), number=1000) / 1000 y_matching.append(avg_runtime) # Calculate triangle numbers x_triangle = [j for j in range(1, 51)] y_triangle = [(m ** 2 + m) / 2 for m in range(1, 51)] # Plot both on the same plot plt.plot(x, y_matching, label="Average run times") plt.plot(x_triangle, y_triangle, label="Triangle numbers") plt.xlabel("Length of Matchings / Number of arcs") plt.ylabel("Time / Triangle numbers") plt.title("Average run times vs. Triangle numbers") plt. legend() plt.grid(True) plt.show() Time / Triangle numbers 1200 1000 800 600 400 200 Average run times vs. Triangle numbers Average run times Triangle numbers 0 10 20 30 40 Length of Matchings / Number of arcs 550
import timeit import random import matplotlib.pyplot as plt # Function to count crossings and nestings def count_crossings_and_nestings (matching): # Your implementation of count_crossings_and_nestings goes here pass # Function to generate random matching def random_matching (length): # Your implementation of random_matching goes here pass # Measure the average run times against the lengths of the matchings x = [n for n in range(1, 51)] # 50 arcs y_matching = [ ] for length in x: avg_runtime = timeit.timeit(lambda: count_crossings_and_nestings (random_matching (length)), number=1000) / 1000 y_matching.append(avg_runtime) # Calculate triangle numbers x_triangle = [j for j in range(1, 51)] y_triangle = [(m ** 2 + m) / 2 for m in range(1, 51)] # Plot both on the same plot plt.plot(x, y_matching, label="Average run times") plt.plot(x_triangle, y_triangle, label="Triangle numbers") plt.xlabel("Length of Matchings / Number of arcs") plt.ylabel("Time / Triangle numbers") plt.title("Average run times vs. Triangle numbers") plt. legend() plt.grid(True) plt.show() Time / Triangle numbers 1200 1000 800 600 400 200 Average run times vs. Triangle numbers Average run times Triangle numbers 0 10 20 30 40 Length of Matchings / Number of arcs 550

Database System Concepts
7th Edition
ISBN:9780078022159
Author:Abraham Silberschatz Professor, Henry F. Korth, S. Sudarshan
Publisher:Abraham Silberschatz Professor, Henry F. Korth, S. Sudarshan
Chapter1: Introduction
Section: Chapter Questions
Problem 1PE

Related questions
Question
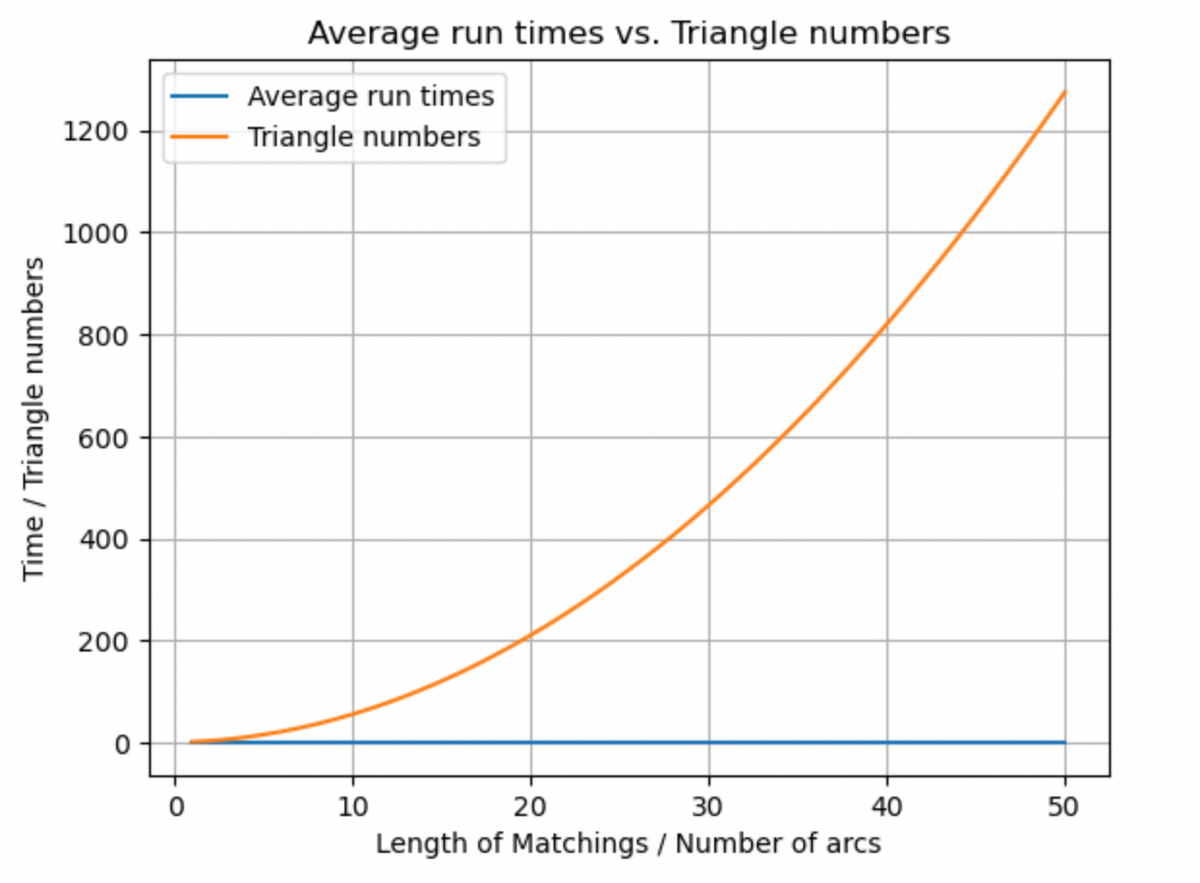
Question: The module timeit allows you to compute the time a function call takes. Verify your answer about the time complexity by computing the run time for randomly chosen arc diagrams of suitable sizes and producing an appropriate plot of the average run times against the lengths of the matchings.
Can you help me to check my code and also can you provide an interpretation to my results(the graph).
![import timeit
import random
import matplotlib.pyplot as plt
# Function to count crossings and nestings
def count_crossings_and_nestings (matching):
# Your implementation of count_crossings_and_nestings goes here
pass
# Function to generate random matching
def random_matching (length):
# Your implementation of random_matching goes here
pass
# Measure the average run times against the lengths of the matchings
x = [n for n in range(1, 51)] # 50 arcs
y_matching = [ ]
for length in x:
avg_runtime =
timeit.timeit(lambda: count_crossings_and_nestings (random_matching (length)), number=1000) / 1000
y_matching.append(avg_runtime)
# Calculate triangle numbers
x_triangle = [j for j in range(1, 51)]
y_triangle = [(m ** 2 + m) / 2 for m in range(1, 51)]
# Plot both on the same plot
plt.plot(x, y_matching, label="Average run times")
plt.plot(x_triangle, y_triangle, label="Triangle numbers")
plt.xlabel("Length of Matchings / Number of arcs")
plt.ylabel("Time / Triangle numbers")
plt.title("Average run times vs. Triangle numbers")
plt. legend()
plt.grid(True)
plt.show()](/v2/_next/image?url=https%3A%2F%2Fcontent.bartleby.com%2Fqna-images%2Fquestion%2F033c0d82-90fb-4c58-9b03-1325bfffdb8d%2F82bac231-35c9-4a0b-9bd7-9269bebb0a20%2F78nes1b_processed.png&w=3840&q=75)
Transcribed Image Text:import timeit
import random
import matplotlib.pyplot as plt
# Function to count crossings and nestings
def count_crossings_and_nestings (matching):
# Your implementation of count_crossings_and_nestings goes here
pass
# Function to generate random matching
def random_matching (length):
# Your implementation of random_matching goes here
pass
# Measure the average run times against the lengths of the matchings
x = [n for n in range(1, 51)] # 50 arcs
y_matching = [ ]
for length in x:
avg_runtime =
timeit.timeit(lambda: count_crossings_and_nestings (random_matching (length)), number=1000) / 1000
y_matching.append(avg_runtime)
# Calculate triangle numbers
x_triangle = [j for j in range(1, 51)]
y_triangle = [(m ** 2 + m) / 2 for m in range(1, 51)]
# Plot both on the same plot
plt.plot(x, y_matching, label="Average run times")
plt.plot(x_triangle, y_triangle, label="Triangle numbers")
plt.xlabel("Length of Matchings / Number of arcs")
plt.ylabel("Time / Triangle numbers")
plt.title("Average run times vs. Triangle numbers")
plt. legend()
plt.grid(True)
plt.show()
Transcribed Image Text:Time / Triangle numbers
1200
1000
800
600
400
200
Average run times vs. Triangle numbers
Average run times
Triangle numbers
0
10
20
30
40
Length of Matchings / Number of arcs
550
Expert Solution
This question has been solved!
Explore an expertly crafted, step-by-step solution for a thorough understanding of key concepts.

Step by step
Solved in 2 steps with 1 images

Recommended textbooks for you
Database System Concepts
Computer Science
ISBN:
9780078022159
Author:
Abraham Silberschatz Professor, Henry F. Korth, S. Sudarshan
Publisher:
McGraw-Hill Education

Starting Out with Python (4th Edition)
Computer Science
ISBN:
9780134444321
Author:
Tony Gaddis
Publisher:
PEARSON

Digital Fundamentals (11th Edition)
Computer Science
ISBN:
9780132737968
Author:
Thomas L. Floyd
Publisher:
PEARSON
Database System Concepts
Computer Science
ISBN:
9780078022159
Author:
Abraham Silberschatz Professor, Henry F. Korth, S. Sudarshan
Publisher:
McGraw-Hill Education
Starting Out with Python (4th Edition)
Computer Science
ISBN:
9780134444321
Author:
Tony Gaddis
Publisher:
PEARSON
Digital Fundamentals (11th Edition)
Computer Science
ISBN:
9780132737968
Author:
Thomas L. Floyd
Publisher:
PEARSON

C How to Program (8th Edition)
Computer Science
ISBN:
9780133976892
Author:
Paul J. Deitel, Harvey Deitel
Publisher:
PEARSON

Database Systems: Design, Implementation, & Manag…
Computer Science
ISBN:
9781337627900
Author:
Carlos Coronel, Steven Morris
Publisher:
Cengage Learning

Programmable Logic Controllers
Computer Science
ISBN:
9780073373843
Author:
Frank D. Petruzella
Publisher:
McGraw-Hill Education