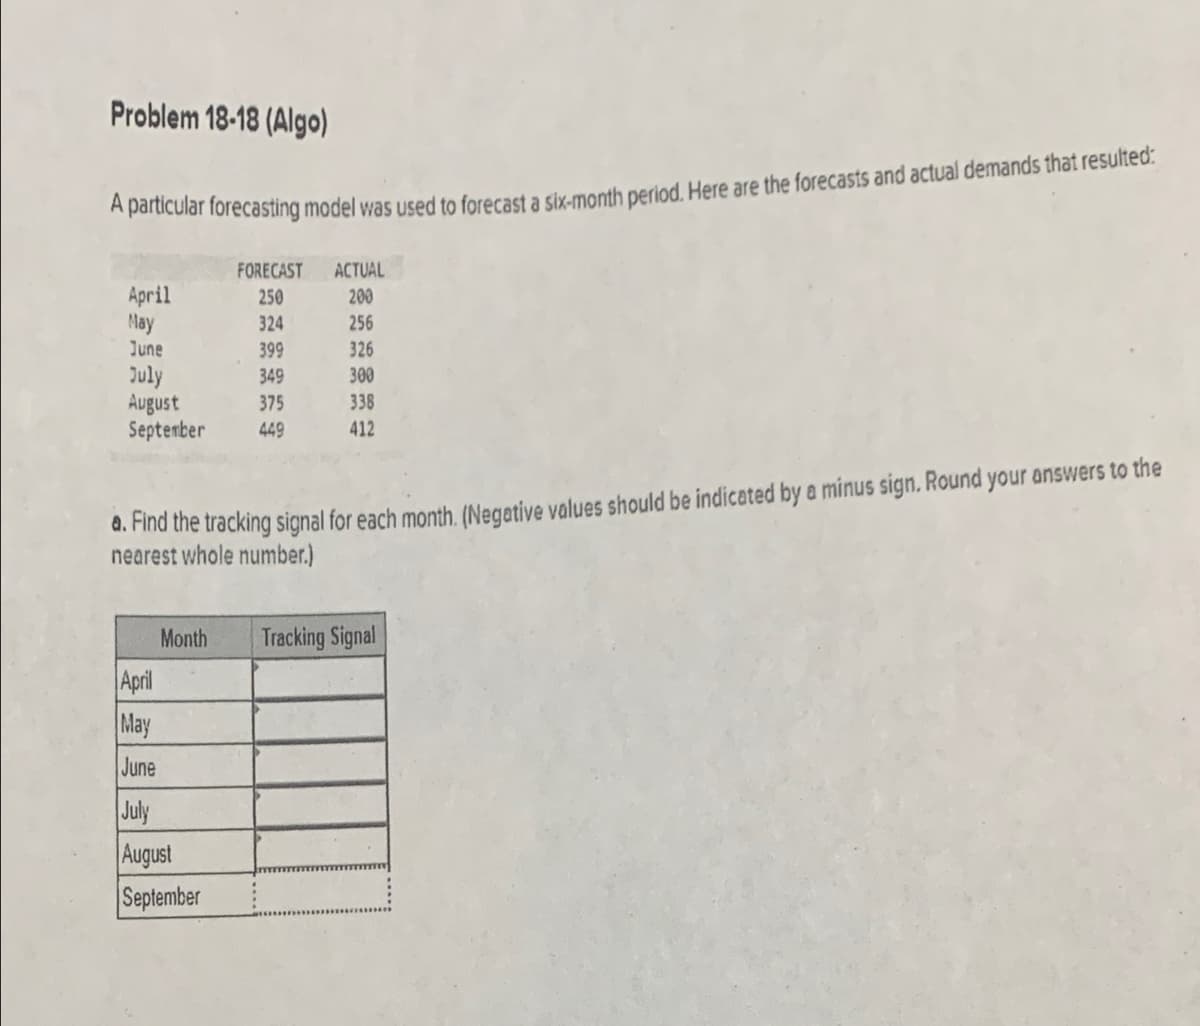
Problem 18-18 (Algo) A parucular forecasting model was used to forecast a six-month period. Here are the forecasts and actual demands that resulted: FORECAST ACTUAL April May June 250 200 324 256 399 326 July August Septenber 349 300 375 338 449 412 d. Find the tracking signal for each month. (Negative values should be indicated by a minus sign. Round your answers to the nearest whole number.) Month Tracking Signal April May June July August September


Q: 1. Which of the following is NOT a probability sampling technique? A. pure random sampling C. system...
A:
Q: 0.3. Calculate co-efficient of correlation between x & y by direct method, when x= 78 89 97 69 59 79...
A:
Q: It is known that the mean diameters of rivets produced by two firms A and B are practically the same...
A: Given that For firm A Sample size=22 Standard deviation =2.9 For firm B Sample size =16 Standard ...
Q: Find the likelihood of Rain when the Train is Late. i.e find Pr(Rain|Late). www
A:
Q: 70 63 60 30 20 20 15 10 8 None Both Legs Only Wheels Only Type of Robotic Limbs Number of Robots
A: The handwritten solution.
Q: Calculation of Quartile Deviation-Individual Observation Series EXAMPLE 5. Calculate Quartile Deviat...
A: Given that The data are 55,60,70,90,90,110,120,130,145,145,155,170
Q: When analyzing a correlation, the null hypothesis states that: Group of answer choices the correlati...
A: Here when we analysing correlation coefficient ,we take null and alternative hypothesis.
Q: State the null hypothesis; Determine the level of measurement of the variables under study; Choose t...
A: Test is that whether the variables Vocabulary Skills and Writing Skills are correlated significantl...
Q: density 18 Drponentt paramete (1) Find the method of moment estimator ô of 0. Show that ô is unbiase...
A:
Q: For the following scores, X Y 3 4 0 1 6 6 3 1 Drag blue round points onto the following graph to s...
A:
Q: The frequency distribution of weight in grams of mangoes of a given variety is given below. Calculat...
A: Given that Class Frequency 410 - 419 14 420 - 429 20 430 - 439 42 440 - 449 54 450 - 4...
Q: Q1. Given the Venn Diagram: Prob. Venn Diagram A 0.3 0.1 B 0.4 Find Pr( Not-A 'AND’ Not-B ). А. О.1 ...
A:
Q: 6. The - shows the number of observations with values smaller than the upper class boundary. A. grea...
A: Solution-: The --------- shows the number of observations with values smaller than the upper class b...
Q: A population consists of four numbers 3, 4, 2, 5. Consider ail possible distinct samples (without re...
A:
Q: A charitable organisation decided to give old age pensions to people over sixty years of age. The sc...
A:
Q: A mail-order computer business has six telephone lines. Let X denote the number of lines in use at a...
A: Given : X and corresponding p(x) We have to calculate cdf F(x) & Have to choose correct option....
Q: Find the average rate of increase in population which in the first decade had increased by 20%, in t...
A:
Q: The average wages paid to all workers in a factory was $. 5000. The average wages paid to male and f...
A: Given: Let n be total number of people, x be number of males and n-x be number of females. Average w...
Q: he following random sample was obtained from a normally distributed population with unknown populati...
A: We have given that data 17.1 6.5 4.4 7.5 9.2 - 4.9 7.9 22.3 I want to find mean and variance. Unbi...
Q: a private school students can choose only of French, Spanish or Music as their Elective. In a group...
A: Given that In a group of students, the number of males and females studying Spanish, French or Musi...
Q: From the following information, find the standard deviation of x and y variable: Σχ= 235, Σχ?= 6750,...
A:
Q: What do you understand by independence of attributes ? Give a criterion of independence for attribut...
A:
Q: Initially there were 9 workers, all being paid a uniform wage. Later a 10th worker is added whose wa...
A: Given: 9 workers have same wage. New person has wage rate which is $20 less.
Q: Calculate the following probabilities directly from the cdf: (a) p(2), that is, P(X = 2) (b) P(X > 3...
A: The cumulative distribution function F(x) is defined as F(x) = P(X ≤ 2) Note : According to our guid...
Q: In a random sample of 1000 persons from town A, 400 are found to be consumers of wheat. In a sample ...
A:
Q: a) In a private school students can choose only of French, Spanish or Music as their Elective. In a ...
A:
Q: 700 and a standard deviation of 100 points. Sammy's score was higher than 93.7% of all participant s...
A: Given: let x be the score follow normal distribution with mean mu=700 and standard deviations=100...
Q: .From the following data construct simple average of relatives quantity index number in 1986 with 19...
A:
Q: Statistics and Probability A game will be held in a tournament, will be selected in the four teams A...
A: game will be held in a tournament, will be selected in the four teams ABCD 40 players. They decided ...
Q: Q. 12. From the following data construct quantity index number using weighted average of relative me...
A:
Q: Question II: Show that in the case of the single analysis of frequency and severity, the credibility...
A:
Q: 16. The shows the number of observations with values smaller than the upper class boundary. A. great...
A: we have to identify correct term used to show number of observations with values smaller than the up...
Q: Consider again a random sample X1,..., Xn from the population distribution with density f (x; 0) = 0...
A:
Q: Four different survey were done to understand the policies of the government. Fifteen persons were c...
A: The observed counts of "yes" responses for each of the surveys are: Assume the significance level...
Q: 1. (Prob. 13-54, p. 571) An article in Lubrication Engineering (December 1990) described the results...
A:
Q: Q. 2. Calculate Karl Pearsons co-efficient of correlation from the height of students. Height in Inc...
A: Given that X Y 62 50 58 43 65 51 63 52 56 48 59 51 60 53 67 55 64 56
Q: In an entrance test for admission 900 students appeared. Their average marks were 50 and standard de...
A: Given that n=900 Mean=μ=50 Standard deviation=σ=20
Q: 1) What is the standard deviation of the sampling distribution for this situation? Round to four pla...
A: Given : n=72 Mean=149000 Population standard deviation =44000
Q: In a survey of 83 people, 23 consider themselves republicans, 21 consider themselves democrats. The ...
A:
Q: 1. Assume p = 100 and 6 = 16 1.1 What is the probability of selecting at random from the general pop...
A:
Q: The life-time in hours of a certain electrical equipment has the normal distribution with mean - 80 ...
A:
Q: Student A Student B Student C Mean 67.1 67.02 67.68 SD 0.2549509757 0.1095445115 0.3563705936 %RSD 0...
A:
Q: When computing a correlation coefficient, if you have 27 degrees of freedom, your sample size must b...
A: Here we know that degree of freedom of correlation coefficient is (n-2).
Q: From the following information, find the standard deviation of x and y variable : Σχ= 235, Σχ26750, ...
A:
Q: Carl is conducting a research study and finds a significant positive correlation between a state's p...
A: The correct option is (B). Confounding variable
Q: Q. Calculate mean from the following by applying direct method: Group of item : Frequency : 0-5 5-10...
A:
Q: A variable is normally distributed with mean 18 and standard deviation 5. Use your graphing calculat...
A:
Q: .From the following data construct simple average of relatives quantity index number in 1986 with 19...
A: Given The data is as follows: Commodity Price in 1985 Price in 1986 A 6 12 B 8 14 C 12 1...
Q: 17. In constructing a/an . class frequencies are on the vertical axis. In this presentation of data,...
A: Here we have to find which diagram suits the given information..
Q: A distribution consists of three frequencies 250, 300, 350 having means 30, 15 and 20 and standard d...
A:


Trending now
This is a popular solution!

Step by step
Solved in 3 steps with 3 images

- Problem 3: A research study was conducted to examine the clinical efficacy of a new antidepressant. Depressed patients were randomly assigned to one of three groups: a placebo group, a group that received a low dose of the drug, and a group that received a moderate dose of the drug. After four weeks of treatment, the patients completed the Beck Depression Inventory. The higher the score, the more depressed the patient. The data are presented below. Compute the appropriate test. Placebo Low Dose Moderate Dose 38 22 14 47 19 26 39 8 11 25 23 18 42 31 5 USING SPSS Give the following: Null hypothesis Alternative hypothesis Statistical test Computation Decision ConclusionProblem # 2 Gold Trackers monitors the price of precious metals, and has daily data on prices and sales of gold for the past several years. One of their new MBA financial wizards has estimated the following relationship for gold sales in the past year of trading (250 observations): Q = 4000 – 0.01 P + 1.5 I – 1.25 X + 2.0 S (857) (0.002) (0.65) (0.44) (0.48) R 2= 0.96 Where Q = daily sale of gold in ounces, P is the price of gold in dollars per ounce, I is the most recent one-month report on US CPI inflation (in percent), X is an index on the exchange rate of the US dollar compared to seven other currencies, and S is the market price of an ounce of silver in dollars. Standard errors are in parentheses. a) Evaluate the results of this regression. Compute t-statistics and F-statistic. b) Recently the price of gold has been $380 per ounce, inflation was measured at 0.2% for the month, the dollar has been trading at 99.7 on the foreign exchange index, and silver has been…Table 10-2 A problem with a phone line that prevents a customer from receiving or making calls is upsetting to both the customer and the telecommunications company. The file “Phone” contains samples of 20 problems reported to two different offices of a telecommunications company and the time toclear these problems (in minutes) from the customers’ lines: Central Office I Time to Clear Problems (minutes) 1.48 1.75 0.78 2.85 0.52 1.60 4.15 3.97 1.48 3.10 1.02 0.53 0.93 1.60 0.80 1.05 6.32 3.93 5.45 0.97 Central Office II Time to Clear Problems (minutes) 7.55 3.75 0.10 1.10 0.60 0.52 3.30 2.10 0.58 4.02 3.75 0.65 1.92 0.60 1.53 4.23 0.08 1.48 1.65 0.72 Assuming that the population variances from both offices are not equal, is there evidence of a difference in the mean waiting time between two offices? (Use a = 0.01) ▪ You may need to download file “Phone”. Referring to Table 10-2, judging from the way the data were collected, which test would likely be most appropriate to…
- Table 10-2 A problem with a phone line that prevents a customer from receiving or making calls is upsetting to both the customer and the telecommunications company. The file “Phone” contains samples of 20 problems reported to two different offices of a telecommunications company and the time toclear these problems (in minutes) from the customers’ lines: Central Office I Time to Clear Problems (minutes) 1.48 1.75 0.78 2.85 0.52 1.60 4.15 3.97 1.48 3.10 1.02 0.53 0.93 1.60 0.80 1.05 6.32 3.93 5.45 0.97 Central Office II Time to Clear Problems (minutes) 7.55 3.75 0.10 1.10 0.60 0.52 3.30 2.10 0.58 4.02 3.75 0.65 1.92 0.60 1.53 4.23 0.08 1.48 1.65 0.72 Assuming that the population variances from both offices are not equal, is there evidence of a difference in the mean waiting time between two offices? (Use a = 0.01) ▪ You may need to download file “Phone”. Referring to Table 10-2, at the α = 0.05 level, the correct critical value(s) is (are) Question 3 options:…Table 10-2 A problem with a phone line that prevents a customer from receiving or making calls is upsetting to both the customer and the telecommunications company. The file “Phone” contains samples of 20 problems reported to two different offices of a telecommunications company and the time toclear these problems (in minutes) from the customers’ lines: Central Office I Time to Clear Problems (minutes) 1.48 1.75 0.78 2.85 0.52 1.60 4.15 3.97 1.48 3.10 1.02 0.53 0.93 1.60 0.80 1.05 6.32 3.93 5.45 0.97 Central Office II Time to Clear Problems (minutes) 7.55 3.75 0.10 1.10 0.60 0.52 3.30 2.10 0.58 4.02 3.75 0.65 1.92 0.60 1.53 4.23 0.08 1.48 1.65 0.72 Assuming that the population variances from both offices are not equal, is there evidence of a difference in the mean waiting time between two offices? (Use a = 0.01) ▪ You may need to download file “Phone”. Referring to Table 10-2, at the α = 0.05 level, the decision is Question 5 options: 1) Cannot…Table 10-2 A problem with a phone line that prevents a customer from receiving or making calls is upsetting to both the customer and the telecommunications company. The file “Phone” contains samples of 20 problems reported to two different offices of a telecommunications company and the time toclear these problems (in minutes) from the customers’ lines: Central Office I Time to Clear Problems (minutes) 1.48 1.75 0.78 2.85 0.52 1.60 4.15 3.97 1.48 3.10 1.02 0.53 0.93 1.60 0.80 1.05 6.32 3.93 5.45 0.97 Central Office II Time to Clear Problems (minutes) 7.55 3.75 0.10 1.10 0.60 0.52 3.30 2.10 0.58 4.02 3.75 0.65 1.92 0.60 1.53 4.23 0.08 1.48 1.65 0.72 Assuming that the population variances from both offices are not equal, is there evidence of a difference in the mean waiting time between two offices? (Use a = 0.01) ▪ You may need to download file “Phone”. Referring to Table 10-2, the correct test statistic is Question 4 options: 1) 2.04, -2.04.…
- Problem#1: Exercise and diet are being studied as possible substitutes for medication to lower blood pressure. Three groups of subjects will be used to study the effect of exercise. Group 1 is sedentary, while group 2 walks and group 3 swims for 1 hour a day. Half of each of the three exercise groups will be on a salt-free diet. An additional group of subjects will not exercise or restrict their salt, but will take the standard medication. Use Z for sedentary, W for walker, S for swimmer, Y for salt, N for no salt, M for medication, and F for medication free (a) Show all of the elements of the sample space S. (b) Given that A is the set of nonmedicated subjects and B is the set of walkers, list the elements of A ∪ B. (c) List the elements of A ∩ B.Rework problem 23 in section 6.3 of your textbook (page 276) except use the following data instead of the data in the textbook: Assume that the production of 1 unit of magnesium requires 0.2 units of magnesium and 0.3 units of aluminum, and that the production of 1 unit of aluminum requires 0.2 units of magnesium and 0.8 units of aluminum.Find the production schedule that satisfies an external demand for 30 units of magnesium and 60 units of aluminum. Rework problem 23 in section 6.3 of your textbook (page 276) except use the following data instead of the data in the textbook: Assume that the production of 1 unit of magnesium requires 0.2 units of magnesium and 0.3 units of aluminum, and that the production of 1 unit of aluminum requires 0.2 units of magnesium and 0.8 units of aluminum. Please look at attched image and show steps to solve for solutionPROBLEM 5 – HOUSING PRICES Situation: Real Estate One conducted a recent survey of house prices for properties located on the shores of Tawas Bay. Data on 26 recent sales, including the number of bathroom, square feet and bedrooms are below. Selling Price Baths Sq Ft Beds 160000 1.5 1776 3 170000 2 1768 3 178000 1 1219 3 182500 1 1568 2 195100 1.5 1125 3 212500 2 1196 2 245900 2 2128 3 250000 3 1280 3 255000 2 1596 3 258000 3.5 2374 4 267000 2.5 2439 3 268000 2 1470 4 275000 2 1678 4 295000 2.5 1860 3 325000 3 2056 4 325000 3.5 2776 4 328400 2 1408 4 331000 1.5 1972 3 344500 2.5 1736 3 365000 2.5 1990 4 385000 2.5 3640 4 395000 2.5 1918 4 399000 2 2108 3 430000 2 2462 4 430000 2 2615 4 454000 3.5 3700 4 Action: Use…
- Question 12 You work for a freight forwarding company responsible for moving carpenter supplies from Toronto, Canada to Casper, Wyoming. Your company has a standardized variable rate structure in place for these shipments and it is as follows: 0 – 500 lbs $ 100.00 flat rate 501 – 1999 lbs $ 19.00 cwt 2000 – 4999 lbs $ 16.40 cwt 5000 – 9999 lbs $ 13.25 cwt 10000 – 19999 lbs $ 10.25 cwt 20000 – 29999 lbs $ 8.75 cwt 30000 – 45000 lbs $2500.00 flat rate ** Rates are based on 10 pounds per cubic feet A local manufacturer has approached your trucking company about shipping 150 rubbermaid wheelbarrels from Toronto to Casper, Wyoming. The wheelbarrels weigh 45 pounds each including packaging. The dimension of the shipping box is 5’ x 3’ x 2’. What is the volume weight of this shipment?. Total volume weight 4500kg Total volume weight 45,000lb Total…CAsE prOBLEM 4: hEAVENLy ChOCOLATEs WEBsiTE TrANsACTiONs Heavenly Chocolates manufactures and sells quality chocolate products at its plant and retail store located in Saratoga Springs, New York. Two years ago the company developed a website and began selling its products over the Internet. Website sales have exceeded the company’s expectations, and management is now considering strategies to increase sales even further. To learn more about the website customers, a sample of 50 Heavenly Chocolate transactions was selected from the previous month’s sales. Data showing the day of the week each transaction was made, the type of browser the customer used, the time spent on the website, the number of website pages viewed, and the amount spent by each of the 50 customers are contained in the file HeavenlyChocolates. A portion of the data are shown in Table 3.12. Heavenly Chocolates would like to use the sample data to determine if online shoppers who spend more time and view more pages also…Problem 6 Consider a market that sells individual marbles. Qs=2+2*P Qd=11-P A $3 tax on consumers is levied for every marble bought. Plot the quantity supplied, quantity demanded before tax, and quantity demanded after tax (3 different lines). Problem 7 Refer to problem 6. Calculate the deadweight loss caused by tax. Problem 8 Refer to Problem 7. The consumer tax was realized to have been a terrible idea for the marble industry. The tax is removed and in an effort to make up for past losses, there is now a $1.5 subsidy per marble. Calculate the deadweight loss.