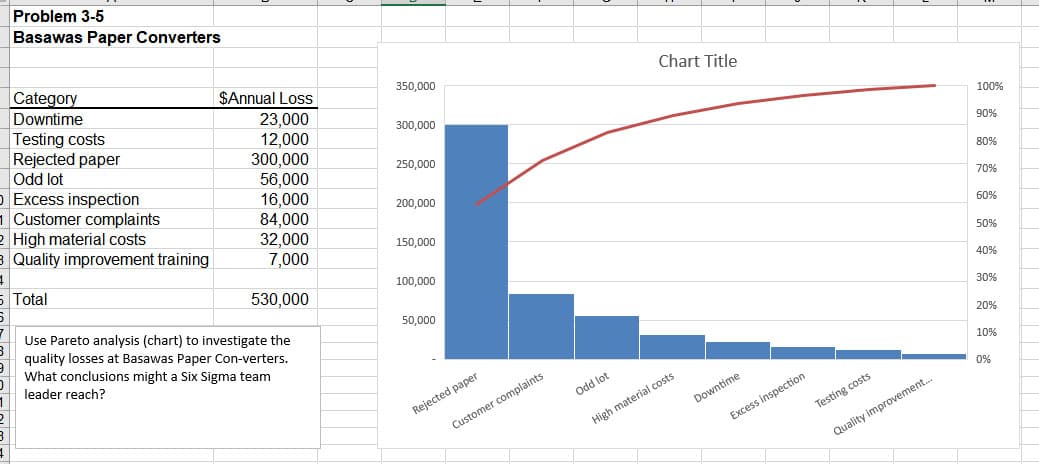
Problem 3-5 Basawas Paper Converters Category $Annual Loss Chart Title Downtime 350,000 Testing costs Rejected paper Odd lot Excess inspection Customer complaints High material costs Quality improvement training 23,000 12,000 300,000 56,000 16,000 84,000 32,000 7,000 300,000 100% 90% 250,000 80% 200,000 70% 150,000 60% Total 50% 100,000 530,000 40% Use Pareto analysis (chart) to investigate the quality losses at Basawas Paper Con-verters. What conclusions might a Six Sigma team leader reach? 50,000 30% 20% 10% Odd lot 0% Rejected paper Downtime Customer complaints High material costs Testing costs Excess inspection Quality improvement.
Problem 3-5 Basawas Paper Converters Category $Annual Loss Chart Title Downtime 350,000 Testing costs Rejected paper Odd lot Excess inspection Customer complaints High material costs Quality improvement training 23,000 12,000 300,000 56,000 16,000 84,000 32,000 7,000 300,000 100% 90% 250,000 80% 200,000 70% 150,000 60% Total 50% 100,000 530,000 40% Use Pareto analysis (chart) to investigate the quality losses at Basawas Paper Con-verters. What conclusions might a Six Sigma team leader reach? 50,000 30% 20% 10% Odd lot 0% Rejected paper Downtime Customer complaints High material costs Testing costs Excess inspection Quality improvement.
Purchasing and Supply Chain Management
6th Edition
ISBN:9781285869681
Author:Robert M. Monczka, Robert B. Handfield, Larry C. Giunipero, James L. Patterson
Publisher:Robert M. Monczka, Robert B. Handfield, Larry C. Giunipero, James L. Patterson
ChapterC: Cases
Section: Chapter Questions
Problem 5.3SD: Scenario 4 Sharon Gillespie, a new buyer at Visionex, Inc., was reviewing quotations for a tooling...
Related questions
Question
Use Pareto analysis (chart) to investigate the quality losses at Basawas Paper Con-verters. What conclusions might a Six Sigma team leader reach?
Image with data attached

Transcribed Image Text:Problem 3-5
Basawas Paper Converters
Category
Downtime
Testing costs
Rejected paper
Odd lot
Excess inspection
1 Customer complaints
2 High material costs
3 Quality improvement training
$Annual Loss
Chart Title
350,000
23,000
12,000
300,000
56,000
16,000
84,000
32,000
7,000
300,000
100%
90%
250,000
80%
200,000
70%
60%
150,000
50%
5 Total
100,000
530,000
40%
Use Pareto analysis (chart) to investigate the
quality losses at Basawas Paper Con-verters.
What conclusions might a Six Sigma team
50,000
30%
20%
leader reach?
10%
0%
Odd lot
Rejected paper
Downtime
Customer complaints
Testing costs
High material costs
Excess inspection
Quality improvement.
Expert Solution
This question has been solved!
Explore an expertly crafted, step-by-step solution for a thorough understanding of key concepts.
This is a popular solution!
Trending now
This is a popular solution!
Step by step
Solved in 2 steps

Knowledge Booster
Learn more about
Need a deep-dive on the concept behind this application? Look no further. Learn more about this topic, operations-management and related others by exploring similar questions and additional content below.Recommended textbooks for you

Purchasing and Supply Chain Management
Operations Management
ISBN:
9781285869681
Author:
Robert M. Monczka, Robert B. Handfield, Larry C. Giunipero, James L. Patterson
Publisher:
Cengage Learning


Purchasing and Supply Chain Management
Operations Management
ISBN:
9781285869681
Author:
Robert M. Monczka, Robert B. Handfield, Larry C. Giunipero, James L. Patterson
Publisher:
Cengage Learning
